Operating review
| Download XLS (22 kB) |
|
TECHNICAL INVESTMENTS |
|||||
|
|
|
|
|
|
|
|
(€ million) |
2012 |
2013 |
2014 |
Change |
% Change |
|
Distribution |
246 |
239 |
231 |
(8) |
(3.3) |
|
Network maintenance and development |
196 |
187 |
180 |
(7) |
(3.7) |
|
Replacement of cast-iron pipes |
50 |
52 |
51 |
(1) |
(1.9) |
|
Metering |
79 |
83 |
88 |
5 |
6.0 |
|
Other investments |
34 |
36 |
40 |
4 |
11.1 |
|
|
359 |
358 |
359 |
1 |
0.3 |
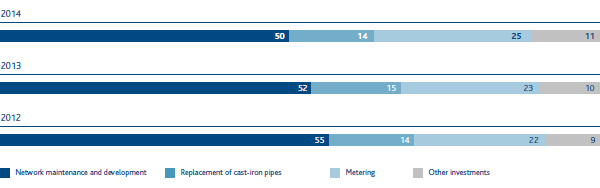
Technical investments in 2014 amounted to €359 million, an increase of €1 million compared with 2013 (€358 million).
Investments in distribution (€231 million) mainly involved development projects (extensions and new networks) and the renovation of old sections of pipe, including the replacement of cast-iron pipes.
Investments in metering (€88 million) primarily concerned the meter replacement programme and the remote meter-reading project.
Other investments (€40 million) mainly concerned investments in IT, property and vehicles.
Distribution network
At 31 December 2014, the gas distribution network covered 55,278 km, an increase of 2,285 km compared with 31 December 2013 (52,993 km).
Gas distribution
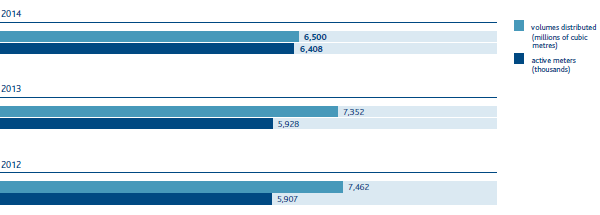
In 2014, 6,500 million cubic metres of gas were distributed, a decrease of 852 million cubic metres, or 11.6%, compared with 2013, due mainly to weather conditions.
At 31 December 2014, Snam had concessions for gas distribution services in 1,437 municipalities (1,435 at 31 December 2013), of which 1,361 were in operation and 76 had to complete and/or create networks (91 in 2013). It had 6.408 million active meters at gas redelivery points to end users (households, businesses, etc.), compared with 5.928 million at 31 December 2013.