Withdrawals of natural gas
| Download XLS (23 kB) |
|
WITHDRAWALS OF NATURAL GAS |
|||||||||
|
|
|
|
|
|
|
||||
|
(billion m3) |
2012 |
2013 |
2014 |
Change |
% Change |
||||
|
|||||||||
|
Redelivery to the domestic market |
73.49 |
69.05 |
60.97 |
(8.08) |
(11.7) |
||||
|
Exports and transit (*) |
0.38 |
0.28 |
0.28 |
|
|
||||
|
Consumption and emissions attributable to Snam Rete Gas |
0.27 |
0.25 |
0.18 |
(0.07) |
(28.0) |
||||
|
Unaccounted-for gas (UFG) and other changes (**) |
0.13 |
(0.10) |
(0.01) |
0.09 |
(90.0) |
||||
|
Total withdrawals of natural gas |
74.27 |
69.48 |
61.42 |
(8.06) |
(11.6) |
||||
The natural gas withdrawn from the national transportation network in 2014 (61.42 billion cubic metres) is mainly destined for: (i) redelivery to users at network exit points (60.97 billion cubic metres; −11.7%); (ii) exports and transit (0.28 billion cubic metres), mainly to Slovenia; and (iii) consumption by the compression stations and gas emissions from the network and from Snam Rete Gas plants (0.18 billion cubic metres).
| Download XLS (23 kB) |
|
RECONCILIATION OF THE GAS WITHDRAWN FROM THE NETWORK AND ITALIAN DEMAND |
|||||||||||||
|
|
|
|
|
|
|
||||||||
|
(billion m3) |
2012 |
2013(*) |
2014 |
Change |
% Change(**) |
||||||||
|
|||||||||||||
|
Quantities withdrawn |
74.27 |
69.48 |
61.42 |
(8.06) |
(11.6) |
||||||||
|
Exports (−) (***) |
(0.38) |
(0.28) |
(0.28) |
|
|
||||||||
|
Gas injected into the regional networks of other operators |
0.05 |
0.05 |
0.05 |
|
|
||||||||
|
Other consumption (****) |
0.97 |
0.82 |
0.75 |
(0.07) |
(8.5) |
||||||||
|
Total Italian demand |
74.91 |
70.07 |
61.94 |
(8.13) |
(11.6) |
||||||||
| Download XLS (23 kB) |
|
DEMAND FOR GAS IN ITALY |
|||||||||||||
|
|
|
|
|
|
|
||||||||
|
(billion m3) |
2012 |
2013(*) |
2014 |
Change |
% Change(**) |
||||||||
|
|||||||||||||
|
Residential and tertiary |
31.00 |
31.09 |
25.82 |
(5.27) |
(17.0) |
||||||||
|
Thermoelectric |
25.29 |
20.60 |
17.73 |
(2.87) |
(14.0) |
||||||||
|
Industrial (***) |
16.64 |
16.51 |
16.32 |
(0.19) |
(1.1) |
||||||||
|
Other (****) |
1.98 |
1.87 |
2.07 |
0.20 |
10.8 |
||||||||
|
|
74.91 |
70.07 |
61.94 |
(8.13) |
(11.6) |
||||||||
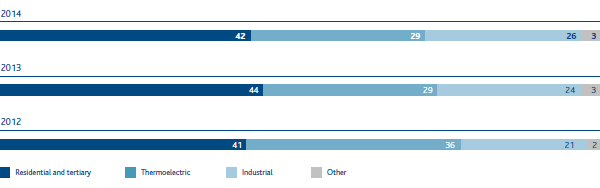
Gas demand in Italy was 61.94 billion cubic metres in 2014, down by 8.13 billion cubic metres (−11.6%) compared with 2013. This decrease, which occurred in all sectors, reflected lower consumption in the residential and tertiary sector (−5.27 billion cubic metres; −17.0%), due mainly to weather trends, and in the thermoelectric sector (−2.87 billion cubic metres; −14.0%), due to a contraction in electricity demand and simultaneous growth in the production of energy from renewable sources (mainly hydroelectric and photovoltaic power).
Adjusted for weather effect, gas demand was 66.97 billion cubic metres, down 3.15 billion cubic metres (−4.5%) compared with 2013 (70.12 billion cubic metres).
GAS DEMAND BY SECTOR (% OF TOTAL GAS DEMAND)
| Download XLS (23 kB) |
|
|
|
|
|
|
|
|
|
|
|
|
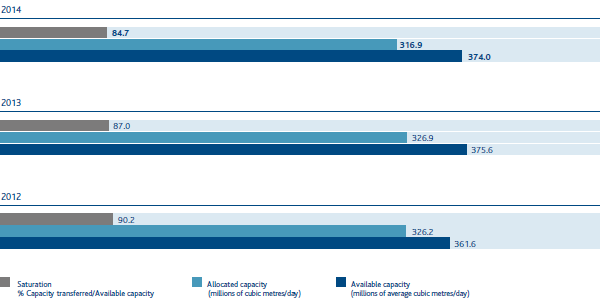
(million m3/ |
Calendar year 2012 |
Calendar year 2013 |
Calendar year 2014 |
||||||
|
Transportation capacity |
Allocated capacity |
Saturation (%) |
Transportation capacity |
Allocated capacity |
Saturation (%) |
Transportation capacity |
Allocated capacity |
Saturation (%) |
|
|
Tarvisio |
114.4 |
109.7 |
95.9 |
113.6 |
105.8 |
93.2 |
112.8 |
99.1 |
87.9 |
|
Mazara del Vallo |
103.0 |
87.8 |
85.2 |
102.9 |
86.7 |
84.3 |
102.5 |
86.6 |
84.5 |
|
Gries Pass |
64.4 |
61.8 |
96.0 |
64.4 |
57.4 |
89.1 |
64.4 |
53.7 |
83.4 |
|
Gela |
35.6 |
31.2 |
87.6 |
35.5 |
29.9 |
84.2 |
35.1 |
30.9 |
88.0 |
|
Cavarzere (LNG) |
26.4 |
23.9 |
90.5 |
26.4 |
21.0 |
79.5 |
26.4 |
24.4 |
92.4 |
|
Livorno (LNG) |
|
|
|
15.0 |
15.0 |
100.0 |
15.0 |
15.0 |
100.0 |
|
Panigaglia (LNG) |
13.0 |
11.3 |
86.9 |
13.0 |
11.0 |
84.6 |
13.0 |
7.1 |
54.6 |
|
Gorizia |
4.8 |
0.5 |
10.4 |
4.8 |
0.1 |
2.1 |
4.8 |
0.1 |
2.1 |
|
|
361.6 |
326.2 |
90.2 |
375.6 |
326.9 |
87.0 |
374.0 |
316.9 |
84.7 |
The transportation capacity of the network again covered all user demand in 2014. Average transportation capacity provided in 2014 was 374 million cubic metres on average per day. In addition to the aforementioned capacities which concern the entry points interconnected with foreign countries and the LNG terminals, a transportation capacity totalling 31 million cubic metres on average per day is available at the domestic production entry points.
Lastly, ISO 9001 certification has been confirmed for the transportation capacity definition process.