Innovation and quality of services GRI - G4: 4
Simplifying commercial processes
Over the last ten years, the Italian gas market has experienced a constant upward trend in the number of operators. In 2014 alone, the number of users active in transportation rose significantly from 108 to 134 (+24%), and during the same year, 45 connection agreements were entered into for the creation of new delivery/redelivery points. Based on the new rules, operators may carry out gas exchanges by purchasing transportation capacity not only over a time horizon of a year or many years, but also on a daily basis, thereby increasing the frequency of transactions.
To manage exchanges among operators and relations with them, over time Snam has developed IT systems and web portals that now represent a separate form of capital for the company and are regularly updated.
To be specific, in 2014 systems to improve management linked to the Balancing Scheme were developed together with users of the web portals. In addition, new functions were introduced, which, on the basis of information provided by distribution companies, make it possible to assess the so-called Appropriate Capacity allowing users to monitor their balancing position to protect the gas system.
Also in 2014, Snam created a new portal dedicated to the transportation sector called ServiRe, which, among other things, supports: the “discatura” (termination of existing redelivery points) and opening of redelivery points on the transportation network; activities in preparation for the organisation and activation of an alternate supply service using canister cars due to transportation service interruptions; the management of users of the transportation service, distribution companies and owners of plants connected to the methane pipeline network that are available 24-hours a day.
The portal has enabled the use of a well-defined channel of communication and the real time monitoring of progress made on requests, thereby simplifying related activities for users.
Since January 2015, a new IT platform has been available to support gas transportation scheduling and balancing, ensuring the improvement of performance and reliability of the system as well as the flexibility and scalability for the introduction of new requirements such as the new requirements resulting from changes in domestic and European regulations (MWh, nomination cycles, new communication protocols). A workshop targeted at users of the transportation service has been arranged to describe the functions of the new system in support of commercial processes.
Changes in IT systems have also continued for storage activities for an ongoing improvement of the quality and flow of services and as a result of regulations issued by the Electricity and Gas Authority.
The Stogit Capacity Portal, which is useful for providing full coverage of information exchanges with its customers in accordance with the provisions of the Storage Code, was further upgraded in the area of auction-based transfer processes for peak and uniform modulation storage services. In addition, the processes of transferring capacity, contracts and invoicing were created, optimised and consolidated. These were previously implemented and are currently used by all customers.
Furthermore, the SAMPEI portal was implemented; this is an essential system for the management of contracts through: the automated management of the calculation of the “Ru” factor used to stabilise the injection capacity of each individual storage service; amendments due to the new Gas Logistics system; functions related to functional gas, and the automatic sending of data to close out financial statements; automated reporting concerning SCIS controls; management of information flows to the European portal AGSI for the publication of data; the management of gas provided as collateral for transportation balancing; the management of new agreements for various user warehouses and new distribution methods.
Service quality
An average of over 374 million cubic metres of transportation capacity was provided to customers at points of entry on the network during the year. Access to the service was guaranteed for all the operators.
The process of determining all transportation capacities has been ISO 9001 certified since 2011. This confirmation, which was renewed during the year, shows Snam’s constant commitment to developing high-quality systems consisting of software for modelling the network and solving the fluid-dynamics equations that regulate physical gas flows.
In keeping with the Economic Development Ministerial Decree of 27 February 2013, the Company completed the preparation of the first ten-year development plan of its natural gas transportation network, which was submitted, on 29 May 2014, to the Economic Development Ministry, the Electricity and Gas Authority and the regions, and is currently published on the Company’s website. In September, the preparation of the second ten-year development plan began; its approval procedure will be completed in 2015.
With regard to storage activities, the capacity of 11.4 billion cubic metres offered in 2013 was confirmed in 2014 (15.9 if strategic storage is also included). In thermal year 2014-15, the total space assigned was equal to the space offered. Although space assignment auctions were scheduled from April to September (4 monthly auctions in succession), all capacity offered was assigned in the July 2014 auctions. In addition, the demand for storage capacity was greater than the capacity offered.
The Network Codes include a list of indicators for monitoring the quality of service provided by the companies. Customers are automatically compensated in the event of non-compliance with service quality standards in relation to some indicators concerning specific commercial quality levels.
The performance of Snam Group companies remained strong in 2014 with regard to these indicators:
| Download XLS (24 kB) |
|
CUSTOMERS |
|||
|
|
|
|
|
|
|
2012 |
2013 |
2014 |
|
Transportation |
|
|
|
|
Contracted transportation capacity/Available transportation capacity (entry points connected with foreign countries) (%) |
90 |
87 |
85 |
|
Compliance with time frame for issue of connection offer (%) |
100 |
100 |
100 |
|
Compliance with execution times of services subject to specific trading quality standards (%) |
100 |
100 |
100 |
|
Service interruptions with sufficient notice (%) |
98 |
93 |
95 |
|
Regasification |
|
|
|
|
Compliance with maximum time for accepting monthly delivery scheduling proposals (%) |
100 |
100 |
100 |
|
Compliance with maximum period of interruption/reduction in the terminal’s capacity for maintenance operations (%) |
100 |
100 |
100 |
|
Storage |
|
|
|
|
Contracted storage capacity/Available storage capacity (%) |
100 |
86 |
100 |
|
Compliance with execution times of services subject to specific trading quality standards (%) |
100 |
100 |
100 |
|
Compliance with time for the notification of users of revised capacity conferred due to transfers (%) |
78 |
100 |
100 |
|
Connecting flow lines subject to surveillance (%) |
97 |
76 |
76 |
|
Total capacity not available due to service interruptions/reductions (%) |
0 |
0 |
0 |
|
Distribution |
|
|
|
|
Compliance with maximum time set for execution of services subject to specific trading quality standards (%) |
98.7 |
99.3 |
99.1 |
|
Compliance with appointment times agreed with customer (%) |
99.5 |
99.3 |
99.0 |
|
Compliance with standard set for meter reading attempts (%) |
99.7 |
99.9 |
99.9 |
|
High- and medium-pressure networks inspected (%) |
37.2 |
46.3 |
54.6 |
|
Low-pressure network inspected (%) |
35.1 |
44.4 |
34.5 |
|
Compliance with maximum time for arrival at location in response to emergency call-out (%) |
98.6 |
98.3 |
97.2 |
Shipper’s Day
During the year Snam Rete Gas organised an event dedicated to shippers with the aim of presenting the company’s strategy, and it repeated the positive experience of discussing issues concerning the products and services offered in the context of growing flexibility. The meeting also served as an occasion to share the results of the latest Customer Satisfaction survey and describe additional improvement being made in response to information provided by users in the context of constantly enriching the quality of services provided. Nearly 200 people attended the event, representing about 83 companies.
Perceived quality GRI – G4: 27
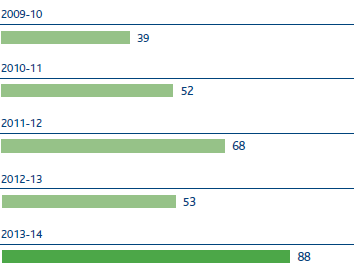
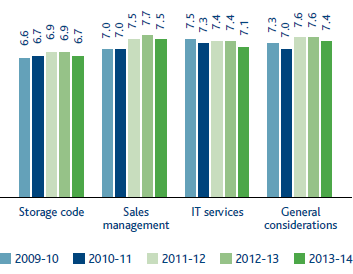
Each year a customer satisfaction survey is performed to identify the degree of satisfaction of storage users with respect to the clarity of the Code, the availability and efficiency of IT services and commercial management. As a part of this survey, user suggestions are gathered with the aim of improving mapped areas of the questionnaire while determining any actions to be taken under their responsibility.
The 2014 survey involved 70 customers, 88% of whom provided responses (53% in 2013). The assessments generally expressed a positive evaluation of the service offered.
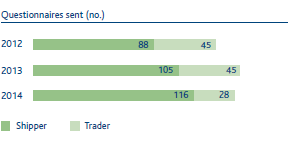
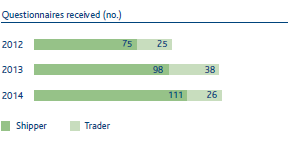
Meetings continued with customers, and especially those that purchased storage capacity for the first time in 2014. These included several traders in addition to the more traditional shippers.
STORAGE ACTIVITIES: RESPONSES RECEIVED BY THERMAL YEAR (%)
AVERAGE RESULTS BY THERMAL YEAR (no.)
The customer satisfaction survey (now at its third edition) for transportation activities was conducted in 2014 using innovative software making it possible to compile the assessment questionnaire online, and it involved customers qualified to operate at the virtual exchange point.
On the one hand, the analysis concerned the customer satisfaction survey with improvements made by the company based on the results of the survey for the previous year, concerning: (i) the website, making the portions highlighted as critical areas clearer and more intuitive, (ii) online services with the development of new or existing portals, and (iii) business processes in order to make products more consistent with the actual needs of counterparties.
On the other hand, the survey covered several issues concerning commercial services and possible changes in the way of providing them.
A total of 144 individuals participated in the questionnaire with a participation rate of over 95%. Participants expressed greater satisfaction with this type of initiative than in previous years. The individuals interviewed admitted they were an active part of these initiatives and defined them as an opportunity to express improvements to business processes.
TRANSPORTATION ACTIVITIES: PARTICIPATION IN THE INDAGES OF CUSTOMER SATISFATION
EVALUATIONS CUSTOMERS ON THE INITIATIVE OF CUSTOMER SATISFATION (%)
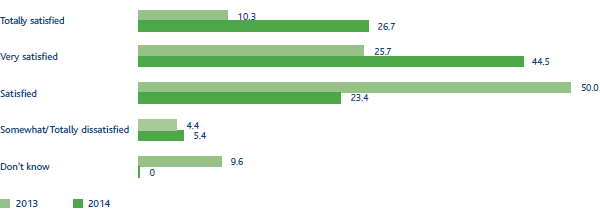
93.4% of respondents were satisfied or very satisfied with the improvement plan implemented during the year. With regard to the quality of service provided in terms of the process and availability of points of contact, there was also an overall improvement in the perception of the service including as a result of implementing the afore-mentioned plan.