Financial results and assets

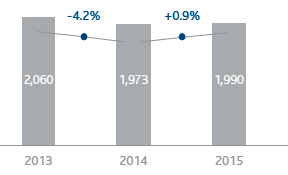
ADJUSTED EBIT (€ million)
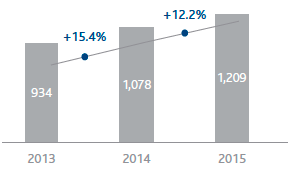
ADJUSTED NET PROFIT (€ million)
Financial results and assets
Snam once again delivered excellent results in 2015 thanks to robust operations, strict financial discipline and a growing contribution from our subsidiaries and associates. Adjusted EBIT1, which excludes special items, came to €1,990 million, an increase of €17 million, or 0.9%, compared with 2014. Higher revenue (+€74 million), attributable mainly to the natural gas distribution (thanks in part to changes in the scope of consolidation) and transportation segments, were partially offset by higher operating costs (-€11 million), owing mainly to the effects of changes to the scope of consolidation2, and by higher depreciation and amortisation (-€49 million) in all business segments.
A rise of +6.7% in adjusted EBIT in the distribution segment was offset by a decline of -2.6% in the transportation segment.
Adjusted net profit3, which excludes the positive effect of adjusting deferred taxes pursuant to the 2016 Financial Stability Law4 and the charges associated with the closure of the Gas Fund pursuant to the Law of 6 August 20155, totalled €1,209 million, an increase of €131 million (+12.2%) on 2014. The rise was due essentially to higher adjusted EBIT (+€17 million), lower net financial expense (+€17 million), primarily as a result of lower borrowing costs thanks to Snam’s efforts to optimise its debt structure, higher income from subsidiaries and associates valued using the equity method (+€47 million), and lower income taxes (+€93 million), due mainly to the elimination of the additional IRES charge, known as the Robin Hood Tax, from 1 January 2015.
Net financial debt was €13,779 million at 31 December 2015, compared with €13,652 million at 31 December 2014. The net cash flow from operating activities (€2,054 million), which benefited from the contribution received from investee companies valued using the equity method, allowed us to fully cover the financial requirements associated with net technical and financial investments and to generate a free cash flow of €771 million. Net financial debt, after the payment to shareholders of the 2014 dividend of €875 million, increased by €127 million compared with 2014.
Free cash flow
+€771 million
Dividends
Thanks to its healthy results and solid business fundamentals, the Company will propose a dividend of €0.25 per share to the Shareholders’ Meeting, to be paid from 25 May 2016, confirming Snam’s commitment to an attractive and sustainable remuneration of its shareholders.
2015 dividend
€0.25 per share
Main events
Feasibility study on possible separation of Italgas from Snam
As part of the ongoing process of analysis and evaluation of strategic options to maximise value for its shareholders, and taking into account development of the Group’s various domestic and international businesses, Snam’s Board of Directors identified the opportunity to launch a feasibility study on a possible industrial and corporate restructure to separate Italgas from Snam. This could be carried out through the partial and proportional spin-off of Snam involving all or a part of the equity investment in Italgas.
International growth
On 17 December 2015, Snam S.p.A. finalised the acquisition of the 20% stake held by Statoil Holding Netherlands B.V. in Trans Adriatic Pipeline AG (TAP) at a price of €130 million.
Furthermore, as a result of the acquisition, Snam took the place of Statoil in the shareholders’ loan to TAP for an amount of €78 million as at the closing date, and all rights and commitments to complete the project.
TAP is the company involved in developing the pipeline that extends from the border between Turkey and Greece to Italy (Puglia region) along the southern corridor, making it possible to transport gas produced by the Shah Deniz II deposit in Azerbaijan to European markets under multi-year ship-or-pay agreements.
Snam’s participation in the project will allow it to consolidate its leading role and that of Italian infrastructure in facilitating greater competition among energy sources and in enhancing supply security for European gas.
Investment of Crédit Agricole Assurances (CAA) in TIGF Holding
On 28 January 2015, Snam, GIC and EDF Invest (EDF) signed an agreement with CAA for the latter to acquire 10% in the share capital of TIGF.
The transaction closed on 26 February 2015. Based on a valuation of TIGF’s entire share capital at over €1.8 billion (compared with over €1.3 billion in July 2013, when Snam first acquired shares in the company), Snam received a sum of more than €80 million.
Following the above transaction, Snam, GIC, EDF and CAA indirectly hold 40.5%, 31.5%, 18% and 10% respectively of TIGF’s share capital (as at 31 December 2014, Snam, GIC and EDF held 45%, 35% and 20% respectively).
Optimisation of the Group’s financial structure
Renewal of Euro Medium Term Notes (EMTN) programme
In 2015, the optimisation of the Group’s financial structure continued, with a view to making it fit better with business requirements in terms of loan duration and exposure to interest rates, and at the same time reducing the overall cost of borrowing.
On 22 June 2015, the Snam Board of Directors approved the annual renewal of the EMTN programme, leaving unchanged the maximum bond issuance amount of €12 billion6.
Liability Management transaction
In November 2015, Snam successfully launched and completed a Liability Management transaction involving the repurchase of outstanding bonds with an average fixed-rate coupon of 3.82% and average remaining maturity of under two years for a total nominal value of around €1.0 billion, and the concurrent issue of a new bond with a fixed rate of 1.375% and term of eight years totalling €0.75 billion.
The transaction’s success, which was made possible by Snam’s low risk profile and its high credit rating, made it possible to reduce the risk associated with refinancing maturing bonds and to extend the average term of the debt, thereby optimising Snam’s liquidity profile.
Italgas – Revocation of judicial administration and confirmation of the Company’s Board of Directors
On 9 July 2015, the activities related to the revocation of the judicial administration measure handed down by the Court of Palermo against Italgas were concluded. The Court, taking into account the outcomes of the checks carried out and the active collaboration of the Snam Group, ordered the revocation of the measure by means of a ruling on 29 June 2015.
Having acknowledged the revocation, on 9 July 2015 the Italgas Shareholders’ Meeting reappointed all members of the Company’s Board of Directors, the term of which expires at the Shareholders’ Meeting called to approve the financial statements for the year ended 31 December 2015.
Following the revocation of the judicial administration measure handed down by the Court of Palermo and the confirmation of the Board of Directors by the Shareholders’ Meeting, Italgas is putting in place the measures for implementation of the organisational and procedural plan and for monitoring and verifying the Company’s activities. Italgas is also providing the competent authorities with the information flows provided for under Article 34, paragraph 8 of Legislative Decree 159/2011 (Judicial Control) relating to significant transactions. Italgas has filed an appeal against the provision of said information flows with the Palermo Court of Appeal, and is also providing the competent authorities with the results of the periodic reports of the Watch Structure. For more information, see Note 24, “Guarantees, commitments and risks – Disputes”, of the Notes to the consolidated financial statements.
Post-balance sheet events
The main events relating to the operating segments are described in the “Business segment operating performance” section.
Key financial figures
To improve the economic and financial review, in addition to conventional IAS/IFRS indicators and financial statements, the Directors’ Report also contains reclassified financial statements and several alternative performance indicators such as EBITDA, EBIT, adjusted EBIT, adjusted net profit and net financial debt. The tables below, their explanatory notes and the reclassified financial statements describe how these amounts were determined. Unless otherwise specified, definitions of the terms used can be found in the glossary.
| Download XLS (23 kB) |
(€ million) |
2013 |
2014 |
2015 |
||||
|
|||||||
Total revenue |
3,529 |
3,566 |
3,649 |
||||
- of which from regulated activities |
3,491 |
3,506 |
3,573 |
||||
Operating costs |
726 |
790 |
850 |
||||
EBITDA |
2,803 |
2,776 |
2,799 |
||||
EBIT |
2,034 |
1,973 |
1,950 |
||||
Adjusted EBIT (a) |
2,060 |
1,973 |
1,990 |
||||
Net profit (b) |
917 |
1,198 |
1,238 |
||||
Adjusted net profit (a) (b) |
934 |
1,078 |
1,209 |
||||
| Download XLS (24 kB) |
|
|
2013 |
2014 |
2015 |
||||||
|
||||||||||
EBIT per share (a) |
(€) |
0.602 |
0.583 |
0.557 |
||||||
Net profit per share (a) |
(€) |
0.271 |
0.354 |
0.354 |
||||||
Adjusted net profit per share (a) |
(€) |
0.276 |
0.318 |
0.345 |
||||||
Group shareholders’ equity per share (a) |
(€) |
1.77 |
2.12 |
2.17 |
||||||
Pay-out (Dividends for the period/Net profit) |
% |
92.1 |
73.0 |
70.7 |
||||||
Adjusted pay-out (Dividends for the period/ |
% |
90.5 |
81.2 |
72.4 |
||||||
ROE (b) |
% |
15.4 |
18.2 |
16.8 |
||||||
ROI (c) |
% |
10.8 |
9.8 |
9.2 |
||||||
Dividend yield (dividend for the period/year-end official share price) |
% |
6.2 |
6.1 |
5.2 |
||||||
Price/Book value (Average official price per share/Group shareholders’ equity per share) |
(€) |
2.06 |
2.00 |
2.08 |
||||||
| Download XLS (22 kB) |
(€ million) |
2013 |
2014 |
2015 |
Technical investments |
1,290 |
1,313 |
1,272 |
Net invested capital at 31 December |
19,320 |
20,824 |
21,365 |
Shareholders’ equity including minority interests at 31 December |
5,994 |
7,172 |
7,586 |
Group shareholders’ equity at 31 December |
5,993 |
7,171 |
7,585 |
Net financial debt at 31 December |
13,326 |
13,652 |
13,779 |
Free cash flow |
(92) |
297 |
771 |
| Download XLS (24 kB) |
|
|
2013 |
2014 |
2015 |
||||||
|
||||||||||
Number of shares of share capital |
(millions) |
3,381.6 |
3,500.6 |
3,500.6 |
||||||
Number of shares outstanding at 31 December |
(millions) |
3,380.0 |
3,499.5 |
3,499.5 |
||||||
Average number of shares outstanding during the year |
(millions) |
3,379.5 |
3,384.7 |
3,499.5 |
||||||
Year-end official share price |
(€) |
4.04 |
4.11 |
4.85 |
||||||
Average official share price during the period |
(€) |
3.66 |
4.23 |
4.51 |
||||||
Market capitalisation (a) |
(millions) |
13,655 |
14,383 |
16,973 |
||||||
Dividend per share |
(€ per share) |
0.25 |
0.25 |
0.25 |
||||||
Dividends for the period (b) |
(millions) |
845 |
875 |
875 |
||||||
Dividends paid in the period (c) |
(millions) |
845 |
507 |
875 |
||||||
Breakdown of added value
At Snam, sustainability and the creation of value are strongly connected concepts. Sustainability creates value for the Company and stakeholders, and establishes a connection between the business and corporate social responsibility. The Company produces wealth by contributing to the economic growth of the society and environment in which it operates, and it measures this wealth in terms of added value produced and distributed to its key stakeholders. The table below is useful for understanding the Group’s economic impact and makes it possible to read the consolidated financial statements from the standpoint of stakeholders.
In 2015, the added value produced by Snam was
| Download XLS (24 kB) |
(€ million) |
Reference in Notes to the consolidated financial statements |
2013 (*) |
2014 (*) |
2015 |
||
|
||||||
Core business revenue |
3,735 |
3,784 |
3,856 |
|||
Other revenue and income |
113 |
98 |
114 |
|||
Net financial income/(expense) not related to debt |
(16) |
1 |
(15) |
|||
Income from equity investments |
45 |
131 |
135 |
|||
Less: |
|
|
|
|
||
Raw materials |
(91) |
(123) |
(180) |
|||
Services |
(401) |
(404) |
(389) |
|||
Lease and rental expense |
(88) |
(89) |
(99) |
|||
Capital losses |
(15) |
(21) |
(35) |
|||
Other operating expenses |
(25) |
(70) |
(28) |
|||
Increases for self-constructed assets – Cost of labour and financial expense |
94 |
100 |
95 |
|||
Gross added value |
|
3,351 |
3,407 |
3,454 |
||
Amortisation, depreciation and impairment |
(769) |
(803) |
(849) |
|||
Net added value |
|
2,582 |
2,604 |
2,605 |
||
The added value produced by the Snam Group in 2015 was distributed to stakeholders as follows:
| Download XLS (24 kB) |
(€ million) |
Reference in Notes to the consolidated financial statements |
% |
2013 (*) |
% |
2014 (*) |
% |
2015 |
||||||
|
|||||||||||||
Added value produced (A) |
|
|
2,582 |
|
2,604 |
|
2,605 |
||||||
Added value produced (A) |
|
|
2,510 |
|
2,281 |
|
2,242 |
||||||
Employees (**) |
17.9 |
461 |
16.7 |
436 |
18.5 |
483 |
|||||||
Lenders |
|
19.0 |
490 |
16.7 |
435 |
15.2 |
395 |
||||||
Bondholders |
|
290 |
|
350 |
|
364 |
|||||||
Banks |
|
200 |
|
85 |
|
31 |
|||||||
Shareholders (***) |
|
32.7 |
845 |
33.6 |
875 |
33.6 |
875 |
||||||
Government |
|
27.7 |
714 |
20.5 |
535 |
18.8 |
489 |
||||||
Direct taxes |
|
690 |
|
509 |
|
467 |
|||||||
Indirect taxes |
|
24 |
|
26 |
|
22 |
|||||||
Added value retained within the Group (A) – (B) |
|
2.8 |
72 |
12.4 |
323 |
13.9 |
363 |
||||||
DISTRIBUTION OF ADDED VALUE
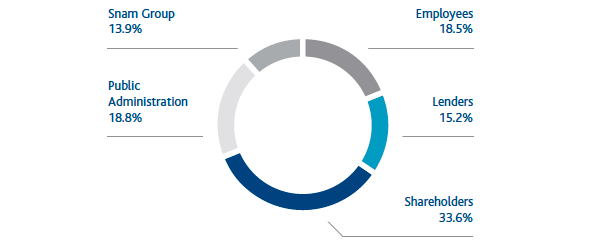
In 2015 the percentage of added value distributed to shareholders through dividends distributed remained stable (33.6%; unchanged from 2014), while there was a reduction in the value paid to the Government through the payment of direct and indirect taxes (18.8%; -1.7% from 2014), resulting from the adjustment of deferred taxes due to the reduction, as of 1 January 2017, of the IRES tax rate from 27.5% to 24%, and a reduction in the value distributed to lenders (15.2%; -1.5% compared to 2014) partly due to measures taken to optimise the Group’s financial structure. However, there was an increase in added value distributed to employees (18.5%; +1.8% compared to 2014) in the form of direct compensation consisting of wages, salaries and severance pay and indirect compensation consisting of social security contributions and staff-related service costs (canteen services, reimbursement of travel expenses) attributable mainly to costs associated with the Gas Fund closure. The Group retained 13.9% of added value produced (+1.5% over 2014).
Changes in business environment
Changes in demand and availability of gas in Italy7
Gas volumes are expressed in standard cubic metres (SCM) with a traditional higher heating value (HHV) of 38.1 MJ/SCM. The basic figure is measured in energy (MJ) and obtained by multiplying the physical cubic metres actually measured by the relative heating value.
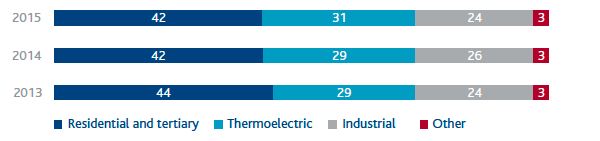
Gas demand in Italy in 2015 was 67.44 billion cubic metres, up 5.53 billion cubic metres (+8.9%) compared with 2014. The increase was due to higher consumption in the thermoelectric sector (+3.01 billion cubic metres; +16.8%), an increase in the demand for electricity and a concurrent reduction in the production of hydroelectric power, which were partially offset by the growing production of energy from other renewable sources (in particular, photovoltaic panels, wind turbines and bioenergy sources), and higher consumption in the residential and tertiary sectors (+2.95 billion cubic metres; +11.5%), largely due to climate conditions.
Adjusted for the weather effect, gas demand was estimated at 68.56 billion cubic metres, up by 1.83 billion cubic metres (+2.7%) compared with 2014 (66.73 billion cubic metres).
Gas demand in Italy
The changes indicated in the following tables in this report are to be seen as changes from financial year 2014 to 2015. Unless otherwise indicated, percentage changes were calculated using the figures indicated in the related tables.
| Download XLS (23 kB) |
(billion m3) |
2013 |
2014 (*) |
2015 |
Change |
% change (**) |
||||||||
|
|||||||||||||
Residential and tertiary |
31.09 |
25.66 |
28.61 |
2.95 |
11.5 |
||||||||
Thermoelectric |
20.60 |
17.88 |
20.89 |
3.01 |
16.8 |
||||||||
Industrial (***) |
16.51 |
16.32 |
15.97 |
(0.35) |
(2.1) |
||||||||
Other (****) |
1.87 |
2.05 |
1.97 |
(0.08) |
(3.9) |
||||||||
|
70.07 |
61.91 |
67.44 |
5.53 |
8.9 |
||||||||
GAS DEMAND BY SECTOR (% of total gas demand)
The availability of natural gas in Italy (66.94 billion cubic metres) is equal to the sum of gas injected into the national transportation network and the net balance of withdrawals from and injections into the storage system, and was up by 5.55 billion cubic metres (+9.0%) compared with 2014. The increase was due to higher volumes of gas injected into the network by entry point (+5.46 billion cubic metres; +9.9%) and lower net injections into the storage system (+0.55 billion cubic metres), which were partially offset by lower domestic production (-0.46 billion cubic metres; -6.7%).
| Download XLS (23 kB) |
(billion m3) |
2013 |
2014(*) |
2015 |
Change |
% change |
||||
|
|||||||||
Gas injected into the network by entry point |
61.54 |
55.36 |
60.82 |
5.46 |
9.9 |
||||
Domestic output |
7.46 |
6.89 |
6.43 |
(0.46) |
(6.7) |
||||
Total gas injected into the network |
69.00 |
62.25 |
67.25 |
5.00 |
8.0 |
||||
Net balance of withdrawal/injection into storage (**) |
0.48 |
(0.86) |
(0.31) |
0.55 |
(64.0) |
||||
Total availability of natural gas |
69.48 |
61.39 |
66.94 |
5.55 |
9.0 |
||||
The natural gas withdrawn from the National Transportation Network in 2015 (66.94 billion cubic metres) was mainly for: (i) redelivery to users at network exit points (66.46 billion cubic metres; +9.0%); (ii) exports and transit (0.27 billion cubic metres); and (iii) consumption by the compression stations and gas emissions from the network and from Snam Rete Gas plants (0.18 billion cubic metres).
| Download XLS (23 kB) |
(billion m3) |
2013 |
2014 |
2015 |
Change |
% change |
||||
|
|||||||||
Redelivery to the domestic market |
69.05 |
60.97 |
66.46 |
5.49 |
9.0 |
||||
Exports and transit (*) |
0.28 |
0.28 |
0.27 |
(0.01) |
(3.6) |
||||
Consumption and emissions attributable to Snam Rete Gas |
0.25 |
0.18 |
0.18 |
|
|
||||
Gas not accounted for and other changes (**) |
(0.10) |
(0.04) |
0.03 |
0.07 |
|
||||
Total withdrawals of natural gas |
69.48 |
61.39 |
66.94 |
5.55 |
9.0 |
||||
| Download XLS (23 kB) |
(billion m3) |
2013 |
2014(*) |
2015 |
Change |
% change |
||||||||
|
|||||||||||||
Quantities withdrawn |
69.48 |
61.39 |
66.94 |
5.55 |
9.0 |
||||||||
Exports (-) (***) |
(0.28) |
(0.28) |
(0.27) |
0.01 |
(3.6) |
||||||||
Gas injected into the regional networks of other operators |
0.05 |
0.05 |
0.03 |
(0.02) |
(40.0) |
||||||||
Other consumption (****) |
0.82 |
0.75 |
0.74 |
(0.01) |
(1.3) |
||||||||
Total Italian demand |
70.07 |
61.91 |
67.44 |
5.53 |
8.9 |
||||||||
Main elements of the pricing framework
By means of Resolutions 514/2013/R/gas, 438/2013/R/gas and 573/2013/R/gas, the Authority defined the tariff criteria for the fourth regulatory period, in force from 1 January 2014, for natural gas transportation, regasification and distribution, respectively. With regard to storage activities, the fourth regulatory period runs from 1 January 2015 according to tariff criteria established by the Authority by means of Resolution 531/2014/R/gas.
Transportation |
4 years |
January 2014 |
December 2017 |
Regasification |
4 years |
January 2014 |
December 2017 |
Storage |
4 years |
January 2015 |
December 2018 |
Distribution |
6 years |
January 2014 |
December 2019 |
Below are the key tariff components for each of the regulated activities performed by Snam based on regulations in force at 31 December 2015. Additional information on the main new tariff provisions introduced in 2015 are provided in the section “Business segment operating performance – Tariff regulations” in this Report.
| Download XLS (1 kB) |
|
|
TRANSPORTATION |
|
REGASIFICATION |
|
STORAGE |
|
DISTRIBUTION |
|||
|
|||||||||||
|
|
|
|
|
|
|
|
|
|
||
|
|
|
|
|
|
|
|
|
|
||
|
End of regulatory period (TARIFFS) |
31 December 2017 |
|
31 December 2017 |
|
31 December 2018 |
|
31 December 2019 |
|
||
|
Calculation of net invested capital recognised for regulatory purposes (RAB) |
Revalued historical cost |
|
Revalued historical cost |
|
Revalued historical cost Deduction of restoration costs |
|
Revalued historical cost Parametric centralised asset method |
|
||
|
Return of net invested capital recognised for regulatory purposes (pre-tax WACC) |
6.3% 2015 |
|
7.3% 2015 |
|
6.0% 2015 |
|
Distribution |
|
||
|
|
|
|
|
|
|
Metering |
|
|||
|
Incentives on new investments |
+1% for 7 years |
|
+2% for 16 years |
|
20% withholding for 8 years for revenues in excess of revenue recognised resulting from insolvency procedures |
|
|
|
||
|
Wacc +1% on new investments made after 31 December 2013 to offset regulatory time lag |
|
Wacc +1% on new investments made after 31 December 2013 to offset regulatory time lag |
|
Return on investments t-1 to offset the regulatory time lag (from 2014) |
|
Return on investments t-1 to offset the regulatory time lag (from 2013) |
|
|||
|
Efficiency factor (X FACTOR) |
2.4% – on operating costs |
|
0% |
|
To be defined by the next provision from the Authority |
|
1.7% – on distribution operating costs |
|
||
|
|
|
|
|
|
0.0% – on metering operating costs |
|
||||
|
|
|
|
|
|
|
|
|
|
||
1 EBIT was analysed by isolating only the elements that determined a change therein. To this end, applying gas segment tariff regulations generates revenue components that are offset in costs.
2 This refers to the natural gas distribution segment and, in particular, the effects of acquiring control of AES Torino (1 July 2014) and Acam Gas (1 April 2015).
3 The reconciliation of reported EBIT and net profit with their adjusted forms can be found in section Financial review in this Report.
4 Among other fiscal measures, Law 208/2015 (2016 Financial Stability Law) on “Measures for the formation of the annual and multi-year government budgets”, which was published in the Official Gazette of 30 December 2015 and came into force on 1 January 2016, made provision for reducing the IRES rate from 27.5% to 24% as of 1 January 2017.
5 As of 1 December 2015, Law 125 of 6 August 2015 closed the Supplementary Fund of compulsory general insurance for disability, old age and survivors for employees of private gas companies (hereinafter the “Gas Fund”), in which approximately 3,500 people from the Group were enrolled, particularly in the distribution segment. The Law established a series of additional employer contributions, estimated at €40 million on the basis of actuarial assumptions (€28 million net of tax).
6 On 23 June 2014, the Snam Board of Directors resolved to extend the EMTN programme for a total amount of €12 billion.
7 Figures for natural gas volume for 2015 are updated to 14 January 2016. The update of 2014 figures has been finalised, and figures are consistent with those published by the Ministry of Economic Development.