Climate protection GRI - G4: EN7, EN15, EN16, EN17, EN19

Greenhouse gases
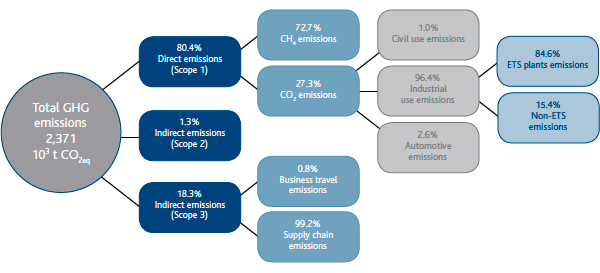
The greenhouse gases (GHG) emitted into the atmosphere by the activities of Snam are carbon dioxide (CO2) and methane (CH4), the main component of natural gas. CO2 is a by-product of the combustion process and is directly associated with the consumption of fuels, while the emissions of natural gas, and therefore CH4, derive partly from the normal operation of the plants and partly from the atmospheric emissions due to the connection of new pipelines and maintenance or to accidental events of the transportation and distribution networks.
In addition to using natural gas as its main fuel, Snam is implementing a series of energy management initiatives to minimise GHG emissions in its operating activities by employing specific containment programmes.
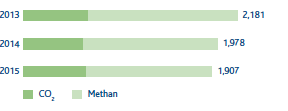
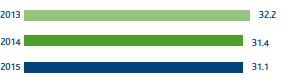
In 2015, total GHG emissions (direct Scope 1, and indirect Scope 2 and Scope 3) were approximately 2.37 million tonnes2.
ToTal ghg emission – Scope 1-2-3 (103 t)

Greenhouse gas emissions – Snam Group
How Snam works to limit greenhouse gas emissions GRI – G4: EN19
- installation of new higher energy efficiency turbines and more efficient heat generators
- installation of photovoltaic plants in buildings and network plants
- replacement of several traditional light sources with LED lights
- natural gas recovery operations (recompression of gas in the transportation network and compression stations)
- replacement of cast-iron pipes in the gas distribution networks
- replacement of several natural gas-fuelled pneumatic actuators
- acquisition of electricity produced from renewable sources for certain sites that use a particularly high amount of energy
- installation of a system for distributing flows more evenly on reduction lines in some gas measurement and regulation plants
- renovation of buildings to improve their energy efficiency rating
- decreased use of air conditioning through the “no ties” summer programme
Avoided 141,000 tonnes of CO2eq
The environmental advantages of natural gas
At equal energy usage, the carbon dioxide produced by the combustion of natural gas is 25-30% less than petroleum products and 40-50% less than coal. The decrease in emissions per unit of energy produced is further accentuated by the possibility of using natural gas in high-performance applications and technologies, such as condensation boilers, co-generation plants and combined cycles for producing electricity. A gas-powered combined cycle with an output of 56-58%, compared with an output of about 40% from traditional steam-powered cycles, makes it possible to reduce CO2 emissions by 52% compared with a traditional fuel oil-powered plant and by 62% compared with a coal-powered plant.
| Download XLS (25 kB) |
Composition |
Unit of measurem. |
Importation Tarvisio (Russian Gas) |
Importation Passo Gries (Northern Europa) |
Importation Mazara del Vallo (Algerian Gas) |
Importation Gela (Libyan Gas) |
Importation Panigaglia (LNG) |
Injection Ravenna (National Gas) |
Injection Falconara (National Gas) |
Interconnect. LNG Minerbio |
Importation OLT Livorno (GNL) |
||
|
||||||||||||
Methane |
%MOLE |
95.554 |
90.807 |
85.200 |
84.890 |
90.154 |
99.634 |
99.440 |
92.997 |
89.272 |
||
Ethane |
%MOLE |
2.632 |
4.733 |
9.205 |
6.418 |
7.080 |
0.059 |
0.019 |
6.672 |
7.073 |
||
Propane |
%MOLE |
0.582 |
0.821 |
1.422 |
2.076 |
1.070 |
0.012 |
0.002 |
0.080 |
1.138 |
||
Isobutane |
%MOLE |
0.097 |
0.141 |
0.131 |
0.285 |
0.081 |
0.005 |
0.002 |
0.005 |
0.129 |
||
Normal Butane |
%MOLE |
0.095 |
128 |
0.176 |
0.449 |
0.100 |
0.001 |
0.002 |
0.005 |
0.277 |
||
Isopentane |
%MOLE |
0.021 |
0.041 |
0.034 |
0.119 |
0.004 |
0.004 |
0.003 |
0.003 |
0.026 |
||
Normal Pentane |
%MOLE |
0.014 |
0.028 |
0.033 |
0.078 |
0.001 |
0.004 |
0.003 |
0.003 |
0.012 |
||
Hexanes + |
%MOLE |
0.019 |
0.037 |
0.038 |
0.021 |
0.001 |
0.000 |
0.000 |
0.000 |
0.020 |
||
Nitrogen |
%MOLE |
0.646 |
1.912 |
1.974 |
4.072 |
0.698 |
0.248 |
0.459 |
0.220 |
1.901 |
||
Carbon dioxide |
%MOLE |
0.337 |
1.322 |
1.676 |
1.477 |
0.000 |
0.033 |
0.068 |
0.001 |
0.117 |
||
Helium |
%MOLE |
0.001 |
0.030 |
0.111 |
0.115 |
0.000 |
0.000 |
0.002 |
0.024 |
0.035 |
||
Oxygen |
%MOLE |
- |
- |
- |
- |
0.085 |
- |
- |
- |
- |
||
|
|
|
|
|
|
|
|
|
|
|
||
Higher heating value |
kJ/m3 |
38,720 |
38,724 |
40,188 |
39,522 |
40,483 |
37,713 |
37,598 |
39,657 |
40,087 |
||
Lower heating value |
kJ/m3 |
34,904 |
34,936 |
36,309 |
35,719 |
36,547 |
33,955 |
33,851 |
35,770 |
36,193 |
||
Direct CO2eq emissions (Scope1)
In 2015, direct CO2eq emissions were approximately 1.91 million tonnes. Direct CO2 emissions from combustion stood at approximately 0.52 million tonnes, while CO2eq emissions deriving from methane emissions were approximately 1.39 million tonnes.
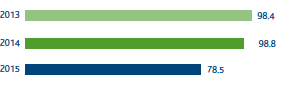
In 2015, the Group’s natural gas emissions decreased compared with 2014, from 95 Mm3 to 78.5 Mm3, also taking into account the contribution of the Acam Gas distribution network, accounted for as of 2015. This decrease is partially attributable to the emission reduction activities carried out in gas storage, but it is primarily due to the gas distribution networks following the review of the emission estimation method.
Direct emissions CO2eq – Scope 1 (103 t)
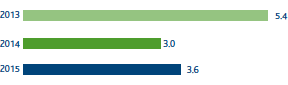
In order to contain natural gas emissions from the transportation network, activities were continued which involve gas recovery through online and compression plant gas recompression interventions (3.6 million cubic metres of natural gas were recovered, representing approximately 63,600 tonnes of CO2eq), as well as the replacement of several plants in the transportation network and storage facilities and pneumatic equipment. As regards containing natural gas emissions in distribution networks, the Company continued to replace cast-iron piping with higher-performance piping (replacing about 29 km of networks).
Natural gas emissions (106 m3)
Natural gas recovered transportation activity (106 m3)
| Download XLS (30 kB) |
KPI description |
KPI date |
Pre-set target |
Target achieved in 2015 |
Sector |
Status of activity |
||||||
|
|||||||||||
Natural gas recovered out of total potential emissions from maintenance activities (*) |
2015 |
Recover 30% every year (2015-2018 period) |
35 |
Transportation |
|
||||||
Contain natural gas emissions in the transportation network |
2014 |
Keep natural gas emissions per year below 1,240 m3/km until 2017 |
1,138 |
Transportation |
|
||||||
Replacement of cast-iron networks (km)(**) |
2010 |
Replace the entire grey cast-iron network by 2017 |
327 |
Distribution |
|
||||||
Contain natural gas emissions in the distribution network (***) |
2014 |
Reach natural gas emissions of 790 m3/km by 2017 |
501 |
Distribution |
|
||||||
|
|
||||||||||
Indirect emissions (Scope 2)
Indirect CO2eq emissions arise from the use of electricity; in 2015 they made up approximately 31,150 tonnes (-1% compared with 2014)3.
In 2015, Snam increased the number of plants supplying it with electricity generated from renewable sources, including: the Messina and Terranuova Bracciolini compression stations (Snam Rete Gas); the gas storage concession in Brugherio (Stogit); and the regasification plant in Panigaglia (GNL Italia). This operation, as well as the use of photovoltaic panels for power generation, enabled the avoidance of approximately 7,560 tonnes of CO2eq equal to roughly 25% of the Snam Group’s total indirect emissions (scope 2).
Indirect emissions CO2eq – Scope 2 (103 t)
Indirect emissions (Scope 3)
Indirect Scope 3 emissions refer to CO2eq emissions related to the supply chain (goods, labour and services) and business travel (business trips, journeys by Snam’s employees as part of their working activities).
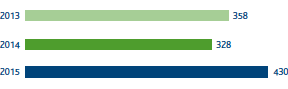
In 2015, CO2eq emissions were approximately 433,000 tonnes (+30% compared with 2014)4. This increase is due to supply chain activities, which resulted in greater procurement (+61.5%) compared with the previous year.
Indirect emissions – Scope 3 – Supply chain (103 t CO2eq)
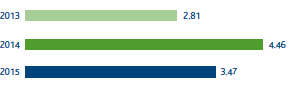
Indirect emissions – Scope 3 – business travel – (103 t CO2eq)
Indirect Scope 3 emissions relating to the supply chain were calculated using methods developed by a leading international company in carbon footprint analysis.
2 In 2015, the method for calculating CO2eq emissions was updated to take into account the information provided in the most recent scientific study conducted by the Intergovernmental Panel on Climate Change (IPCC), “Fifth Assessment Report IPCC”, which assigned methane a GWP of 28 (GWP of 25 in previous years), as well as the updating of distribution network gas emission indices. Distribution emission indices were updated based on specific research conducted by a leading international company, which took into consideration the new technology used in the network in recent years (materials, equipment and junction technologies).
3 Indirect CO2eq deriving from the use of electricity from non-renewable sources was calculated considering the updated factor published by ISPRA (Italian Institute for Environmental Protection and Research) in 2015 in the “National Inventory report 2015”.
4 Scope 3 indirect CO2eq emissions-supply chain do not consolidate AES and ACAM Gas. Scope 3 indirect CO2eq emissions-business travel do not consolidate ACAM Gas.