Snam share performance
The Snam share price ended the first half of 2016 at an official price of €5.29, up 9.0% from the official price of €4.85 recorded at the end of 2015.
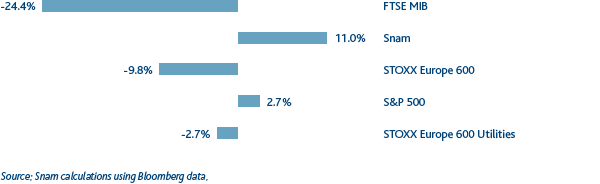
After having suffered slightly from the general fall in share prices in the first weeks of the year, the shares reached new record highs (€5.53) on 30 March, thanks to the recovery in the stock markets and the general reduction in sovereign yields. The fall recorded after the referendum on the United Kingdom leaving the EU was more than recovered after the presentation of the Strategic Plan on 29 June. Following the weakening of global economic growth prospects and the price of oil, which has reached the lowest level for more than 10 years, European share markets, on the other hand, blamed the consistent falls in the first weeks of the year, partly offset thanks to the new monetary policy decisions taken by the central banks and the recovery in oil prices. The result of the Brexit referendum brought share prices close to the minimum levels of February, with a partial recovery later on. Thanks to its defensive and anti-cyclical profile, at a time of falling share prices, the utilities sector has out-performed the European general index (-2.7% vs. -9.8%).
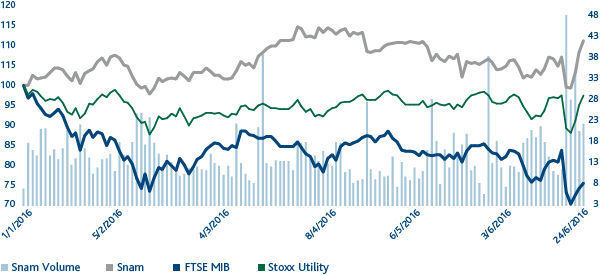
SNAM - Comparison of prices of Snam, FTSE MIB and STOXX Europe 600 Utilities
(1 January 2016 - 30 June 2016)
SNAM - Comparison of Snam’s performance with the main stock market indices (Last Price)
(1 January 2016 - 30 June 2016)