Energy consumption
2016 energy management initiatives:
- installation of high energy efficiency turbines;
- installation of more efficient heat generators (new skids for gas preheating);
- installation and connection to the photovoltaic system grid;
- replacement of traditional bulbs with LEDs;
- renovation of buildings with consequent improvement of the energy rating;
- reduction in the use of air conditioning in the summer.
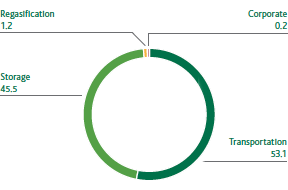
Snam’s main energy consumers are the gas turbines used at the compression stations which supply the necessary pressure for transporting the gas (thrust consumption) and in the storage concessions (storage consumption) which, globally, account for 88% of total consumption.
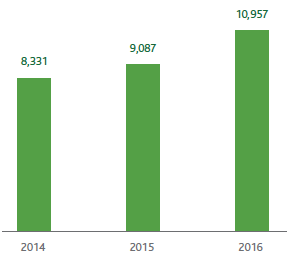
In 2016 energy consumption totalled around 10,957 TJ (+20.6% compared with 2015). This increase is due to the greater quantity of gas transported (+5% compared with 2015), but particularly to the increase in the amounts of gas coming from North Africa (+65% compared with 2015) and the simultaneous reduction in imports from Northern Europe (-37%) and Russia (-5.6%), conditions that resulted in the increase of the average journey of the gas (average journey of a cubic metre from injection into the system until withdrawal) which, in 2016, reached 582 km compared with 419 km in 2015 (+39%).
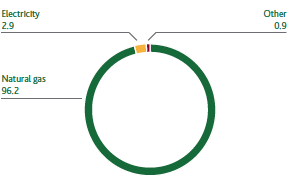
Natural gas covers 96.2% of Snam’s energy requirements. Other sources used are electricity (2.9%) and other fuels (diesel fuel, gasoline, LPG and heat), which together are equivalent to 0.9%.
ENERGY CONSUMPTION (TJ)
ENERGY CONSUMPTION BY ACTIVITY (%)
ENERGY CONSUMPTION BY SOURCE (%)
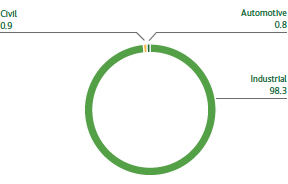
ENERGY CONSUMPTION BY USE (%)
GRI-G4:EN3