Operating review
Gas moved through the storage system
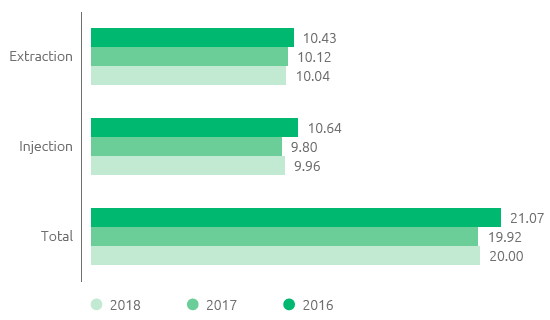
Volumes of gas moved through the storage system in FY 2018 amounted to 21.07 billion cubic metres, an increase of 1.15 billion cubic metres, or 5.8%, compared with FY 2017.
The increase can be attributed to both greater injections for filling storage (+0.84 billion cubic metres; + 8.6%) and to greater deliveries from storage (+0.31 billion cubic metres; +3.1%), mainly following the climatic conditions in the first few months of 2018.
Natural gas moved through the storage system (billions of cubic metres)
| Download XLS (16 kB) |
|
2016 |
2017 |
2018 |
Active customers (shippers) |
91 |
89 |
91 |
In 2018, the integration process continued, as had begun in July 2017, which caused the commercial management activities of the three businesses regarding transmission, storage and regasification, to flow into a single organisation.
In order to manage exchanges among operators and relationships with them, over time Snam has developed IT systems and web portals that now represent a unique feature of the Company that is upgraded regularly.
In this regard, the comprehensive overhaul of the Snam website was completed, redefining the sections relating to the gas transmission, storage and regasification businesses with the aim of improving use of the information by clients and introducing graphic forms of representation.
Network codes list a number of indicators for monitoring the quality of service offered by the companies. Snam companies continued to maintain excellent performance with respect to these indicators in 2018. One part of these indicators, which refers to specific levels of business quality, gives rise to automatic indemnification of customers in the event of a failure to comply with service quality standards.
| Download XLS (17 kB) |
(%) |
2016 |
2017 |
2018 |
Storage capacity allocated under contract/Available storage capacity |
100 |
99.9 |
99.7 |
Compliance with deadlines for performing services subject to specific business quality standards |
100 |
100 |
100 |
Connection flow lines subject to supervision |
100 |
100 |
100 |
Total capacity not made available following interruptions/reductions to the service |
0 |
0 |
0 |
Organisational changes
At end 2018, staff in service numbered 59 resources, in line with 31 December 2017 (60 resources).
In 2018, under the Operations area, the roll-out was completed of SmartGas, also in the compression plants.
With a view to enhancing and organisation of the synergic integration of Italian assets and, after the transfer process of the Stogit business unit “Plants and Technical Services” in 2018, the skilled roles of Snam Rete Gas in the context of Plant Management, Dispatching & Measurements, Engineering and Construction and Supply Chain, as defined by the service contracts, have strengthened and made concrete action aimed at assuring direct control of the operations, maintenance and control activities for storage facilities, storage dispatching operations and engineering
activities, and implementation of investment projects related to surface facilities, improvements to plant engineering and the procurement of goods, works and services. More specifically, two mixed storage and transmission poles have been developed for the operation and maintenance of two new compression plants, Minerbio and Sergnano. Additionally, in 2018 the integrated (transmission-storage) dispatch management project was completed.
In 2018, as part of the project to rationalise and simplify the current Snam regulations, 6 new rules were issued, which will simplify and standardise the operative processes.
Accidents
In 2018, there were 0 accidents involving both employees and contract workers.
| Download XLS (16 kB) |
(no.) |
2016 |
2017 |
2018 |
Total employee accidents |
1 |
2 |
0 |
Total contract worker accidents |
1 |
0 |
0 |
| Download XLS (17 kB) |
|
2016 |
2017 |
2018 |
||||
|
|||||||
Employees |
|
|
|
||||
Frequency index (*) |
2.00 |
6.71 |
0 |
||||
Severity index (**) |
0.110 |
0.43 |
0 |
||||
Contract workers |
|
|
|
||||
Frequency index (*) |
1.27 |
0 |
0 |
||||
Severity index (**) |
0.07 |
0 |
0 |
||||
Energy consumption and emissions
In 2018, energy consumption for storage rose by 11%, an increase that is in line with the quantity of gas stored in the deposits (+9%). Total nitrogen oxide emissions in 2018 came to 236 tonnes (+34% on 2017), which are due both to the increase in gas storage and the need to use non-DLE Minerbio turbo compressors due to the temporary unavailability of the low-emissions ones. To reduce these emissions, starting 2019 the Minerbio compression plant will only have low-emissions turbo compressors (DLE).
| Download XLS (17 kB) |
|
2016 |
2017 |
2018 |
||
|
|||||
Energy consumption (TJ) |
4,985 |
4,787 |
5,337 |
||
Emissions of CO2eq – scope1 (t) (*) |
461,976 |
447,662 |
475,752 |
||
Emissions of natural gas (106 m3) |
10.7 |
10.7 |
10.5 |
||
NOx emissions (t) |
201 |
175 |
235.7 |
||