Results
In order to allow for a better assessment of the performance of economic-financial operations, this Report includes the reclassified financial statements and some alternative performance indicators (non-GAAP measures), mainly represented by the results in the adjusted configuration1. More specifically, the operating profit and the adjusted net profit are obtained by excluding the special items (respectively gross and net of the related taxes) from the operating profit and the reported net profit, as per the scheme of the Income Statement.
Income entries classified as special items for FY 2018 refer to: (i) the financial expenses deriving from the buy-back of bonds on the market as part of the Liability Management transaction (35 million euro, net of the related tax effect); (ii) the expenses for incentives to take voluntary redundancy in application of the early pension tool regulated by Art. 4, paragraphs 1-7 of Italian Law no. 92/2012, the “Fornero Law”, together with the introduction of the “quota 100”, envisaged by the 2019 Budget Law (15 million euro, net of the related tax effect).
Adjusted results2
EBIT adjusted (million euro)
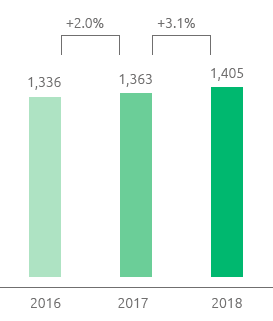
Due to soundness and efficiency of operational management and rigorous financial discipline, Snam achieved very positive results, beyond expectations, in 2018. Adjusted EBIT3 totalled 1,405 million euro, up 42 million euro (3.1%) compared with the same value from the 2017 financial year. The greater revenues (+87 million euro; +3.6%), mainly due to the contribution made by the natural gas transmission sector and the change in the consolidation scope, deriving from company mergers regarding the new businesses of CNG and biomethane, were partially offset by the increase in amortisation, depreciation and impairment (-31 million euro; 4.7%) recorded in all business segments and the increase in operating costs (-14 million euro; 3.3%). This increase is mainly due not only to the change in the consolidation scope, but also to the expenses stemming from the greater use of unaccounted-for-gas (UFG) with respect to the quantities conferred in kind by transmission users, the effects of which were partly absorbed by the efficiency actions implemented, with savings achieve din 2018 of 17 million euro.
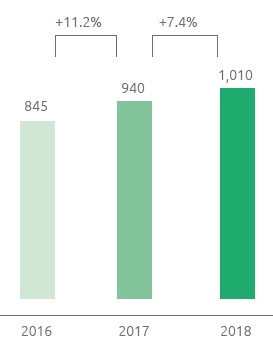
Adjusted net profit (million euro)
As regards business sectors, the increase in adjusted EBIT essentially reflects the positive performance recorded by the transport sector (+33 million euro; +3.1%).
The adjusted net profit totalled 1,010 million euro, up by 70 million euro (+7.4%) compared to the adjusted net profit of 2017. The increase, in addition to greater operating profit (+42 million euro; +3.1%) is due to the lesser net financial expenses (+32 million euro; 14.1%), thanks to the reduction in the average cost of debt, which goes from 2.0% in 2017 to 1.5% in 2018, also due to the benefits deriving from the optimisation action taken in 2016 and 2017, in particular, liability management and the increase in net income from equity investments (+9 million euro; +6.0%). These effects were partly offset by greater income taxes (-13 million euro; 3.8%), due mainly to the rise in pre-tax profit.
Free cash flow
+1,161
million euro
Net financial debt was 11,548 million euro as at 31 December 2018, compared with 11,550 million euro as at 31 December 2017. The net cash flow from operations (1,826 million euro) allowed us to entirely finance net investments (1,036 million euro, including equity investments of 176 million euro). This flow and the collection deriving from the repayment by TAP of the shareholders’ loan (519 million euro; 371 million euro, net of the portions disbursed by Snam during the year), have made it possible to generate free cash flow of 1,161 million euro. Net financial debt, after the payment to shareholders of the 2017 dividend (731 million euro, of which 294 million euro by way of interim dividend and 437 million euro for the balance) and the cash flow deriving from the purchase of treasury shares (426 million euro), shows a reduction of 2 million euro compared to 31 December 2017.
Dividends
Dividend
0.2263
euro per share
Our healthy results and solid business fundamentals allow us to propose a dividend of 0.2263 euro per share to the Shareholders’ Meeting, of which 0.0905 per share was paid in January 2019 as an interim dividend (298 million euro) and the balance of 0.1358 per share will be paid from 26 June 2019 with warrant date 24 June 2019 (record date 25 June 2019). The dividend proposed, up 5% on 2017, in line with the dividends policy announced in the Business Plan, confirms Snam’s commitment to an attractive and sustainable remuneration of its shareholders over time.
| Download XLS (18 kB) |
|
Adjusted |
||||||||
(€ million) |
2016 (b) |
2017 |
2018 |
||||||
|
|||||||||
Total revenue |
2,560 |
2,533 |
2,586 |
||||||
Total revenue net of pass-through items |
2,444 |
2,441 |
2,528 |
||||||
Operating costs |
573 |
511 |
491 |
||||||
Operating costs net of pass-through items |
428 |
419 |
433 |
||||||
EBITDA |
1,987 |
2,022 |
2,095 |
||||||
Operating profit (EBIT) |
1,336 |
1,363 |
1,405 |
||||||
Net profit (c) |
845 |
940 |
1,010 |
||||||
| Download XLS (16 kB) |
(€ million) |
2016 |
2017 |
2018 |
||
|
|||||
Operating profit (EBIT) |
1,293 |
1,348 |
1,384 |
||
Net profit (*) |
861 |
897 |
960 |
||
| Download XLS (18 kB) |
|
|
2016 |
2017 |
2018 |
||||||||||
|
||||||||||||||
Net earnings per share (a) |
(€) |
0.169 |
0.262 |
0.286 |
||||||||||
Adjusted net earnings per share (a) (b) (c) |
(€) |
0.242 |
0.275 |
0.301 |
||||||||||
Group shareholders' equity per share (a) |
(€) |
1.86 |
1.81 |
1.78 |
||||||||||
Pay-out (Dividends for the period/Group net profit) (d) (e) |
% |
83.86 |
81.61 |
77.71 |
||||||||||
Dividend yield (Dividend for the period/Year-end official share price) (d) |
% |
5.4 |
5.3 |
5.9 |
||||||||||
Price/Book value (Average official price per share/Group shareholders’ equity per share) |
(€) |
2.21 |
2.24 |
2.10 |
||||||||||
| Download XLS (17 kB) |
(€ million) |
2016 |
2017 |
2018 |
Technical investments |
906 |
1,034 |
882 |
Net invested capital at 31 December |
17,553 |
17,738 |
17,533 |
Group shareholders’ equity at 31 December |
6,497 |
6,188 |
5,985 |
Net financial debt at 31 December |
11,056 |
11,550 |
11,548 |
Free cash flow |
1,707 |
423 |
1,161 |
| Download XLS (18 kB) |
|
|
2016 |
2017 |
2018 |
||
|
||||||
Number of shares of share capital |
(million) |
3,501 |
3,501 |
3,469 |
||
Number of shares outstanding at 31 December |
(million) |
3,471 |
3,415 |
3,301 |
||
Average number of shares outstanding during the year |
(million) |
3,497 |
3,422 |
3,358 |
||
Year-end official share price |
(€) |
3.923 |
4.086 |
3.820 |
||
Average official share price during the period |
(€) |
4.101 |
4.043 |
3.747 |
||
Market capitalisation |
(million) |
13,612 |
13,953 |
12,606 |
||
Dividend per share |
(€ per share) |
0.2100 |
0.2155 |
0.2263 |
||
Dividends for the period (*) |
(million) |
718 |
732 |
746 |
||
Dividends paid in the period |
(million) |
875 |
718 |
731 |
||
Breakdown of value added
Breakdown of added value
At Snam, sustainability and the creation of value are strongly connected concepts. Sustainability creates value for the Company and stakeholders, and establishes a connection between the business and corporate social responsibility. The Company produces wealth by contributing to the economic growth of the society and environment in which it operates, and it measures this wealth in terms of added value produced and distributed to its key stakeholders.
Snam calculates the added value on the basis of the standard prepared by the Gruppo di Studio per il Bilancio Sociale (GBS) and the GRI Standards.
The table below is useful for understanding the Group’s economic impact and makes it possible to read the consolidated financial statements from the standpoint of stakeholders.
To this end, it should be noted that the calculation of the Value Added was made on the basis of the values drawn from the legal scheme of the Income Statement.
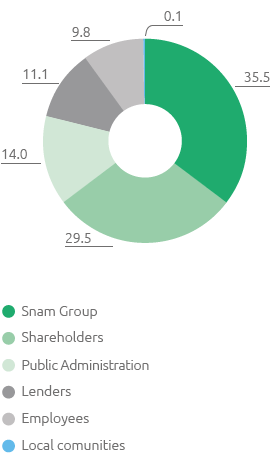
In 2018, the gross global added value produced by Snam was 2,532 million euro: up 85 million euro (3.5%) compared to 2017 (2,447 million euro).
A total of 35.5% of the gross global added value produced by Snam was reinvested within the Group (an increase on 2017: +1.7 percentage points), of which approximately 77% was allocated to the amortisation and depreciation of the infrastructures used in the production process (80% in 2017). As regards the main reference stakeholders, 2018 shows a greater incidence of Value Added distributed to employees (11.1%; +0.9 percentage points on 2017) through direct compensation comprised of wages, salaries and severance pay and indirect compensation comprised of social safety charges and costs for staff-related services (canteen services, travel cost reimbursement). The value allocated to the Public Administration through payment of direct and indirect tax records substantial stability (14.0%; no change on 2017). With reference to lenders, there was a reduction in the value distributed of 2.1 percentage points (9.8%; 11.9% in 2017) also against the benefits deriving from the optimisation actions implemented in 2016 and 2017, in particular the operations of liability management, despite the greater period average debt. The value distributed to shareholders through the distribution of dividends records a stable incidence (29.5%; 29.9% in 2017). In the presence of growth of a unitary dividend (+5% on 2017), as confirmation of the commitment to guarantee shareholders an attractive, sustainable remuneration, a reduction is recorded in the number of shares in issue against the buy-back of treasury shares performed by Snam as part of the share buy-back programme. Lastly, an amount of approximately 3 million euro was designated for local communities (0.1% of the value generated) through donations and sponsorship initiatives and environmental compensation pursuant to the law.
With regard to the environmental protection, Snam spent approximately 105.7 million euro (92.1 million euro for investments and 13.6 million euro for operating costs).
1 For the definition of these indicators and the reconciliation of the economic ones with the related reported results, in line with the guidelines of the 2015/ESMA1415 document “ESMA Guidelines on Alternative Performance Measures” of 05 October 2015, please refer to the chapter “Financial review and other information - Non-GAAP measures”.
2 Unless specified, the FY 2016 results refer to continuing operations. These results, due to the discontinuity factors that characterised 2016 not only exclude the special items but also reflect the Italgas Group's contribution to continuing operations, by applying the relative portion of shares, amounting to 13.5%, to Italgas Group’s net profit for the entire year (pro-forma adjusted configuration).
3 EBIT was analysed by isolating only the elements that resulted in a change to that figure. To this end, applying gas sector tariff regulations generates revenue components that are offset in costs, mainly due to interconnection.