Greenhouse gas emissions

GHG total emissions
-2.6%
compared to 2018
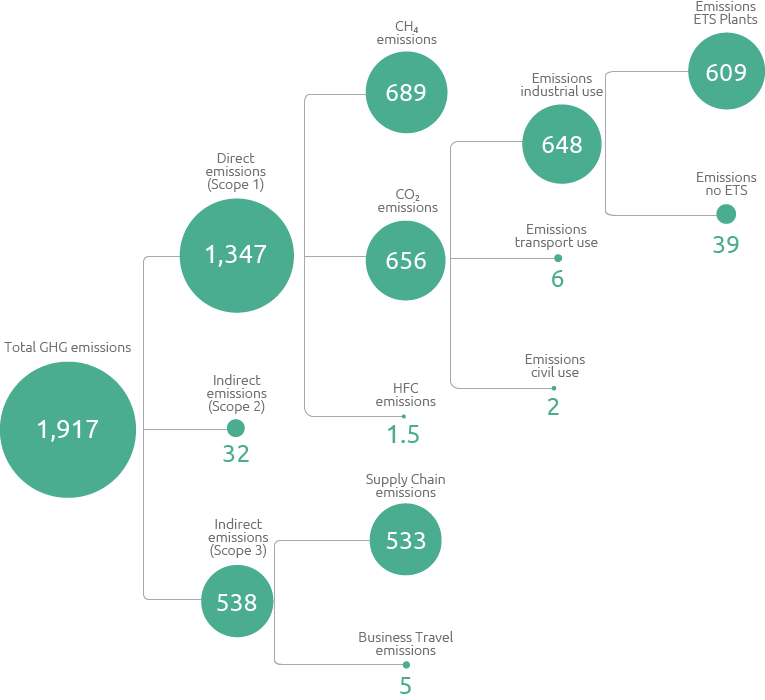
The main greenhouse gas emissions (or GHG) resulting from Snam’s activities are methane (CH4), the main component of natural gas, and carbon dioxide (CO2). Methane emissions arise from the release of natural gas into the atmosphere and are generated by the normal plant operation, by operations to connect new gas pipelines and the maintenance thereof, or by accidental events occurring on infrastructure, whereas the CO2 produced is directly correlated with fuel consumption and the fuel. In 2019, like last year, the marginal contribution to direct emissions from the use of hydrofluorocarbons (HFC) in refrigeration systems was assessed as equal to approximately 1.48 kt CO2eq.
In line with the international reporting methods for GHG emissions, Snam broke down and analysed its emissions into Scope 1 direct emissions and Scope 2 indirect emissions from energy use and Scope 3 other indirect emissions. Direct emissions refer to Snam’s fuel consumption, while indirect emissions refer to electricity consumption and heat consumption (Scope 2) and other CO2 emissions released along the company’s value chain (Scope 3).
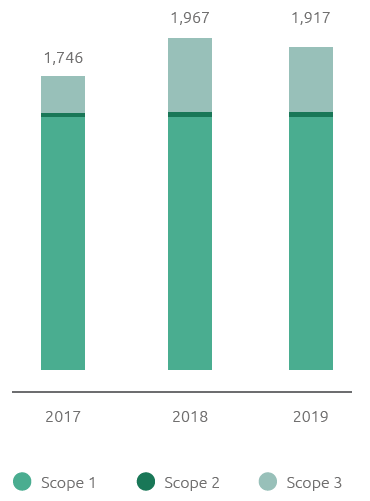
The total GHG emissions stood at around 1.92 thousand tonnes of CO2eq (-2.6% compared to 2018). The total reduction in emissions is mainly due to the interventions implemented to reduce direct emissions (Scope 1), which, however, was mitigated by the increase compared with the previous year of Scope 3 indirect emissions relating to business travel and the emissions generated along the supply chain. Specifically, Snam adopted various initiatives to reduce emissions, such as, for example:
These activities have allowed the Company to prevent the emission into the atmosphere of 181,800 tonnes of CO2eq, the highest figure in recent years (+17% compared to 2018).
- recovery of natural gas emissions;
- production of electricity from photovoltaic plants;
- acquisition of green electricity;
- installation of LED lighting systems;
- renovation and efficiency improvements for buildings;
- greater use of smart working among employees.
GHG emissions (kt CO2eq)

Greenhouse gas (ghg) emissions kt CO2eq
