| Download XLS (16 kB) |
|
(€ million) |
2009 |
2010 |
2011 |
Change |
Change % |
|
Distribution |
192 |
237 |
215 |
(22) |
(9.3) |
|
Network maintenance and development |
158 |
196 |
171 |
(25) |
(12.8) |
|
Replacement of cast-iron pipes (2% incentive) |
34 |
41 |
44 |
3 |
7.3 |
|
Metering (8% return) |
110 |
112 |
144 |
32 |
28.6 |
|
Other investments |
32 |
37 |
35 |
(2) |
(5.4) |
|
|
334 |
386 |
394 |
8 |
2.1 |
Investments in distribution (€215 million) mainly relate to the renovation of sections of pipes by replacing cast-iron pipes, and extending and upgrading the distribution network.
Investments in metering (€144 million) mainly relate to the meter replacement programme and remote meter reading.
Other investments (€35 million) mainly relate to investments in IT, property, and other operating assets.
Gas distribution
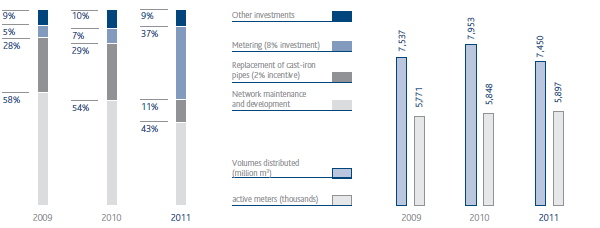
During 2011, 7,450 million cubic metres of gas were distributed, a decrease of 503 million cubic metres, or 6.3%, compared to 2010, mainly due to the milder temperatures recorded during the year.
At 31 December 2011, Snam had concessions for gas distribution services in 1,449 municipalities (1,448 at 31 December 2010), of which 1,330 were in operation and 119 had to complete and/or create the networks. It had 5.897 million active meters at gas redelivery points to end users (households, businesses, etc.), compared with 5.848 million at 31 December 2010.
SHARE OF INVESTMENTS |
ACTIVE METERS AND VOLUMES OF GAS TRANSPORTED |
Distribution network
As at 31 December 2011, the gas distribution network covered 50,301 kilometres (50,307 kilometres at 31 December 2010). The slight reduction of six kilometres is due to the balance between the increases and decreases in the network. The increases are primarily due to:
- winning the tender for the Ussita (MC) concession;
- construction of new networks, particularly in Calabria;
- extensions of networks to meet commitments deriving from concession contracts.


