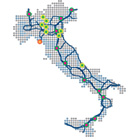
The business segments in which Snam operates have been identified on the basis of the criteria adopted for the preparation of operational reporting by senior management when taking business decisions. The segments identified are as follows: (i) natural gas transportation; (ii) LNG regasification; (iii) natural gas distribution; and (iv) natural gas storage. They relate to the activities carried out, predominantly, by Snam Rete Gas, GNL Italia, Italgas and Stogit, respectively.
| Download XLS (20 kB) |
|
(€ million) |
Transportation and dispatch |
Distribution |
Storage |
Regasi- |
Profits on stock |
Total | ||||
| ||||||||||
|
2010 |
|
|
|
|
|
| ||||
|
Net core business revenue (a) |
1,929 |
1,233 |
355 |
35 |
|
3,552 | ||||
|
Less: inter-segment revenue |
(41) |
(2) |
(23) |
(11) |
|
(77) | ||||
|
Revenue from third parties |
1,888 |
1,231 |
332 |
24 |
|
3,475 | ||||
|
Other revenue and income |
6 |
28 |
2 |
|
(3) |
33 | ||||
|
Net accrual to provisions for risks and charges |
(10) |
15 |
1 |
|
|
6 | ||||
|
Depreciation, amortisation and impairment losses |
(430) |
(168) |
(76) |
(4) |
|
(678) | ||||
|
1,185 |
455 |
218 |
7 |
(3) |
1,862 | |||||
|
Equity method valuation effect |
|
47 |
|
|
|
47 | ||||
|
Directly attributable current assets (b) |
621 |
394 |
142 |
17 |
|
1,174 | ||||
|
Directly attributable non-current assets (b) |
11,421 |
4,097 |
2,961 |
90 |
|
18,569 | ||||
|
Of which: |
|
|
|
|
|
| ||||
|
- Equity-accounted investments |
|
319 |
|
|
|
319 | ||||
|
Directly attributable current liabilities |
3,291 |
730 |
695 |
22 |
|
4,738 | ||||
|
Directly attributable non-current liabilities |
6,244 |
1,481 |
1,362 |
17 |
|
9,104 | ||||
|
Capital expenditure |
902 |
386 |
252 |
3 |
(3) |
1,540 | ||||
|
2011 |
|
|
|
|
|
| ||||
|
Net core business revenue (a) |
1,945 |
1,297 |
372 |
34 |
|
3,648 | ||||
|
Less: inter-segment revenue |
(62) |
(1) |
(35) |
(11) |
|
(109) | ||||
|
Revenue from third parties |
1,883 |
1,296 |
337 |
23 |
|
3,539 | ||||
|
Other revenue and income |
13 |
49 |
3 |
1 |
|
66 | ||||
|
Net accrual to provisions for risks and charges |
10 |
18 |
|
(1) |
|
27 | ||||
|
Depreciation, amortisation and impairment losses |
(435) |
(158) |
(56) |
(5) |
|
(654) | ||||
|
EBIT |
1,137 |
559 |
255 |
7 |
|
1,958 | ||||
|
Equity method valuation effect |
|
45 |
|
|
|
45 | ||||
|
Directly attributable current assets |
754 |
454 |
602 |
13 |
|
1,823 | ||||
|
Directly attributable non-current assets |
11,905 |
4,248 |
3,060 |
89 |
|
19,302 | ||||
|
Of which: |
|
|
|
|
|
| ||||
|
- Equity-accounted investments |
1 |
318 |
|
|
|
319 | ||||
|
Directly attributable current liabilities |
3,797 |
984 |
1,098 |
16 |
|
5,895 | ||||
|
Directly attributable non-current liabilities |
6,390 |
1,293 |
1,469 |
15 |
|
9,167 | ||||
|
Capital expenditure |
892 |
394 |
296 |
3 |
|
1,585 | ||||
Revenue is generated by applying regulated tariffs or market conditions. Revenue of the company is generated entirely in Italy; costs are incurred almost entirely in Italy.


