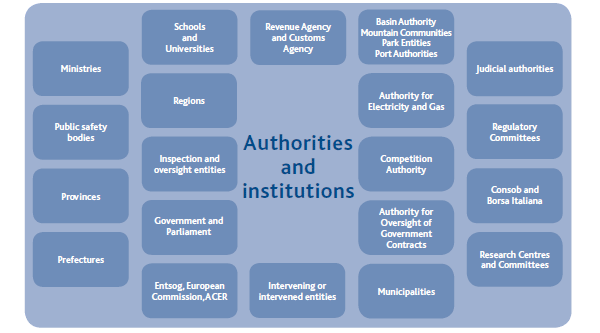
Building consensus and trust with all stakeholders is a key factor for Snam in developing its role as a responsible company. Dialogue, debate and inclusion are the foundations on which it seeks to build a relationship with stakeholders that is sustainable over the long term.
The Company maintains transparent and constant relations with investors, entities, institutions and companies through a system of engagement articulated at every company level.
MAP OF STAKEHOLDERS
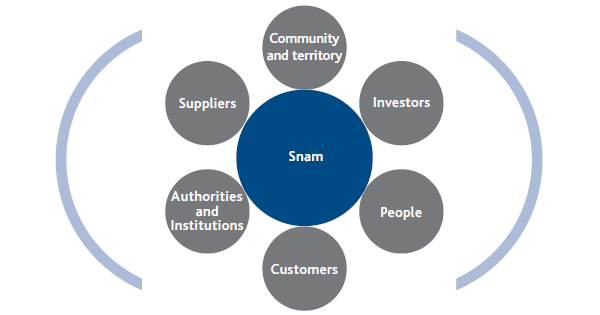
2011 stakeholders’ identity card
PEOPLE
LA1-EC7
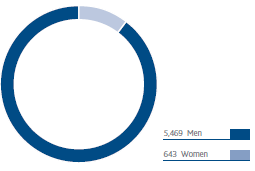
Group staff: 6,112
Type of employees
Enlarge image |
Distribution of employees by geographical areaEnlarge image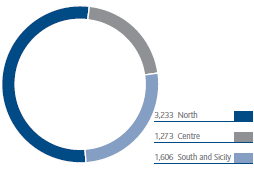 |
CUSTOMERS
Number of customers
Enlarge image
SUPPLIERS
INVESTORS
Shareholder base of Snam by type of investor
Enlarge image
Snam shareholder base by geographical area
COMMUNITIES AND TERRITORY
Snam Group - local sites per region (No.)
Enlarge image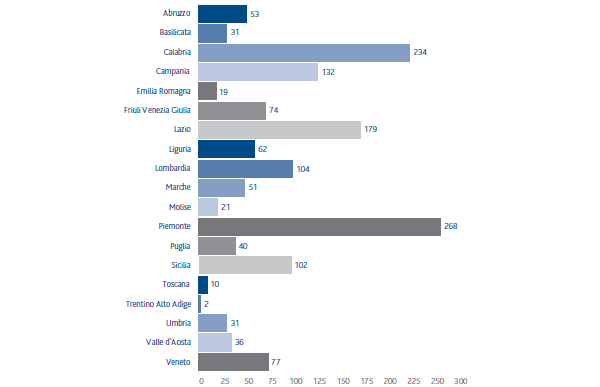
AUTHORITIES AND INSTITUTIONS
Distribution of added value
In 2011, Snam distributed to its stakeholders an overall amount of €2,394 million (€2,250 million in 2010), corresponding to the sum of the added value produced (€2,373 million), or 67% of revenue, and the resources drawn by the company system (€21 million). Of this amount, 37.84% was distributed to the government (€906 million), 33.88% to shareholders (€811 million), 17.34% to employees (€415 million) and 10.94% to lenders (€262 million).
The net overall added value was therefore distributed among different beneficiaries as follows: (i) employees (direct compensation comprising salaries, wages and post-employment benefits, and indirect compensation consisting of social security expenses, as well as costs for staff services (meal services, travel expense reimbursement, etc.); (ii) government (income tax); (iii) lenders (interest on loan capital disbursements); (iv) shareholders (dividends distributed).
EC1
| Download XLS (20 kB) |
|
GLOBAL ADDED VALUE (€ millions) |
2010 |
2011 | ||
| ||||
|
Core business revenues |
3,475 |
3,539 | ||
|
Other revenues and income |
33 |
66 | ||
|
Purchases, provision of services and other costs * |
596 |
631 | ||
|
Net financial expenses |
120 |
88 | ||
|
Net incomes on equity investments |
47 |
51 | ||
|
Increases due to internal works – Cost of work and financial expenses |
89 |
90 | ||
|
GROSS GLOBAL ADDED VALUE |
2,928 |
3,027 | ||
|
for deduction |
|
| ||
|
Amortisation and depreciations |
678 |
654 | ||
|
NET GLOBAL ADDED VALUE |
2,250 |
2,373 | ||
BREAKDOWN OF ADDED VALUE 2011 (%)

Communications and media
Transparent and accurate communication is the foundation of dialogue with stakeholders and bolsters the corporate citizenship of organisations that interact with local areas and communities in their business.
For Snam, communication is not only a business support, but the best tool for increasing the value of its sustainable approach across all its activities. Commitment to the needs of different stakeholders, proactivity in offering success stories, and satisfying media requests as soon as possible are the pillars supporting Snam’s communications, from a standpoint of mutual gain for itself and for all its stakeholders.
The intrinsic value of corporate communications is thus developed and cultivated in every individual action and through each individual communication medium, including new media, out of the strong conviction that an activity based on dialogue and openness is not only an opportunity for creating additional value, but an indispensable modus operandi for observing the principles of consistency, transparency and propriety that distinguish Snam’s daily operations.
Corporate identity
During 2011, Snam completed the important activity of reviewing the group’s web identity. Begun in 2010, the activity was completed on 1 January 2012 when 9 completely revamped websites went online.
The entry of Stogit and Italgas into the group, the implementation of the ITO (Independent Transmission Operator) model, which led to a broader corporate reorganisation, and the introduction of the new brand identity, together with willingness to dialogue with stakeholders in a clear, direct and transparent manner, were the driving force for asserting a new corporate web identity capable of representing the scope of the change that has taken place.
After some new developments introduced between April and July 2010, the key points of Snam’s new web identity included revising content, new landing pages, a header representing Snam’s segment and an interactive box common to all the sites. These new elements are now common to four sites (Snam Rete Gas, GNL Italia, Stogit and Italgas) which were heterogeneous in terms of technology, content and graphics. The new web identity, which reflects the Company’s organisational change, was defined after initial in-depth benchmarking with competitors/peers and identifying cross-sector best practices. To the four “operational” sites, corresponding to Snam’s four businesses and broken down primarily according to customer/user needs, a fifth “corporate” site was therefore added (www.snam.it), which offers institutional information and is geared toward shareholders, analysts, media and authorities.
Besides asserting the new corporate web identity, the site review also targeted improving access to content, offering new services and identifying a single technological platform. The introduction of a flexible technological solution, such as the common Content Management System (CMS), capable of managing content publication methods in a more structured manner, has also made it possible to speed up publication times, providing a modular approach that is consistent across all the sites.
The success of Snam’s new web identity approach is confirmed by the results published in the annual study, KWD Webranking (previously known as H&H Webranking), which this year published its tenth edition, examining the corporate web communications of the 101 largest Italian companies by capitalisation. Snam held seventh place for the fourth year running, with a score of 76, while in the fifteenth edition of KWD Webranking Europe 500, a European ranking that analyses the 500 largest companies by capitalisation taken from the FT Europe 500 ranking, Snam ranked eleventh, three places higher than the previous year.
In Lundquist CSR Online Awards Italy 2011, a study which has analysed online CSR communications in Italy for four years now, Snam went from ninth to eighth, with an increase of 7 points, confirming the validity of the group’s web policy from the standpoint of clear, transparent and direct dialogue with all its stakeholders.
The Filibro 2012 calendar continued the three-year project aimed at interpreting the calendar concept in an innovative manner: a sort of fusion of genres that makes the work distinctive and capable of describing the Snam of today and, in particular, what it will become in the future. The four installations corresponding to the Filibro panels were the subject of an exhibit held between December 2011 and January 2012 at the Leonardo da Vinci National Museum of Science and Technology in Milan.
