Europe’s financial markets progressed overall in 2012, albeit in a hugely volatile climate.
Stocks across the eurozone fell during the first half of the year, owing mainly to the escalation of the sovereign debt crisis in some peripheral countries and to the possibility that the fallout therefrom may spread to the more stable economies.
During the second half of the year, the ECB’s policies to combat the euro crisis (government bond purchase programmes) and the austerity policies implemented by some governments eased the tensions on the sovereign debt market, which had positive knock-on effects on all the major financial markets. Renewed confidence in the eurozone brought about an overall increase in share and bond prices.
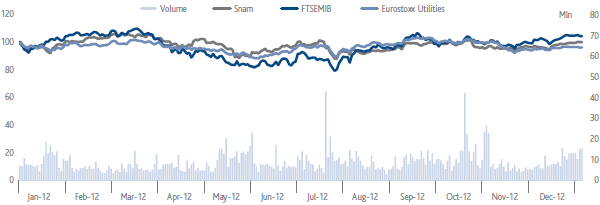
The annual performance of Europe’s leading stock exchanges was positive: the STOXX Euro 50 ended the year up 8.8%, London’s FTSE 100 rose by 5.8%, the DAX in Frankfurt was 29.1% higher and the CAC 40 in Paris closed up 15.2%.
The Italian financial market performed in line with its European counterparts during 2012. As one of the countries most exposed to the debt crisis, Italy witnessed general disaffection among equity and bond investors until the summer. The aforementioned ECB policies and the Italian government’s corrective actions to improve the public accounts then led to a widespread resumption of investments in equities and corporate and government bonds. The FTSE MIB index ended 2012 up 7.8%.
The European utilities sector lost a little ground during the year, with the STOXX Euro 600 Utilities index down 0.7%. This underperformance of the European equity markets was driven by falls in power generation stocks, which were hit by lower margins as a result of reduced demand and excess production capacity. This was partly offset by gains for regulated stocks, which were boosted by their defensive nature in highly volatile markets.
The Snam stock, which also features on the leading international indices (STOXX, S&P, MSCI and the FTSE) as well as on the Italian FTSE MIB index, closed 2012 at an official price of €3.52, up 3.8% from the €3.39 recorded at the end of the previous year.
In 2012, a total of around 2.3 billion Snam shares were traded on the MTA segment of the Italian stock exchange, with the average daily trading volume a shade above 9 million shares (in line with 2011).
Shareholders
The Snam S.p.A. Extraordinary Shareholders’ Meeting of 30 July 2012 resolved to cancel 189,549,700 treasury shares with prior elimination of their par value.
As at 31 December 2012, the Company’s share capital consisted of 3,381,638,294 shares (3,571,187,994 at 31 December 2011), with a total value of €3,571,187,994 (unchanged from 31 December 2011).
As at 31 December 2012, Snam had 2,906,550 treasury shares (192,553,051 at 31 December 2011), equal to 0.09% of the share capital (5.39% at 31 December 2011), with a book value of €12 million. There were 2,521,350 treasury shares tied up in the 2005, 2007 and 2008 stock option plans as at 31 December 2012.
At year end, based on entries in the Shareholders’ Register and other information gathered, CDP Reti S.r.l. held 30.00% of share capital, eni S.p.A. held 20.23%, Snam S.p.A. held 0.09% in the form of treasury shares, and the remaining 49.68% was in the hands of other shareholders.
SNAM - COMPARISON OF PRICES OF SNAM, FTSE MIB AND EURO STOXX 600 UTILITIES
(31 December 2011 - 31 December 2012)

Source: Snam calculations using BLOOMBERG data
SNAM: PERFORMANCE COMPARISON OF THE MAIN STOCK INDICES
KEY SUSTAINABILITY INDICATORS

SHAREHOLDER BASE OF SNAM BY TYPE OF INVESTOR
SNAM SHAREHOLDER BASE BY GEOGRAPHICAL AREA

(*) The total amount of retail investors and treasury shares in the portfolio is included in the Italian percentage


