During 2011 the European financial markets were affected by the escalation s of the problems associated with the sovereign debt of various countries in the euro area, including Italy.
The possible incapacity to refinance the stock of debt due to the size of the debt itself and the increasing cost of debt gradually reduced the confidence of market operators, penalising all European markets, primarily those of countries with higher levels of debt.
Furthermore, during the year the financial markets also suffered from the increasing need of various banks to recapitalise in order to rebalance their capital structure.
Lastly, the austerity moves of various governments to tackle the problems of their public accounts gave rise to downward revisions of the forecasts for economic growth indices for 2012 with, in some cases, predictions of recession.
This had an inevitable negative effect on the annual performance of the primary European markets: the London FTSE 100 index was down 5.6%, the Frankfurt DAX 14.7%, while the CAC 40 in Paris was down 17%. The European Eurostoxx 50 index closed the year down 17%.
During the year the Italian financial markets also sustained a fall in value: the FTSE MIB index, which includes Italy’s 40 largest listed companies by market capitalisation, dropped by 25.2%, while the FTSE Italia All-Share index, which includes all listed companies, was down 24.3%. These performances were motivated by the fact that Italy represented, in the foreign debt crisis, one of the high risk situations for financial market operators, especially in the last part of the year, because of fears of the refinancing of the high public debt. Moreover it should be underlined that the trend of the national indices was influenced by their segmented composition, featuring a prevalence of companies belonging to the banking sector, which during the year recorded a significantly downward trend.
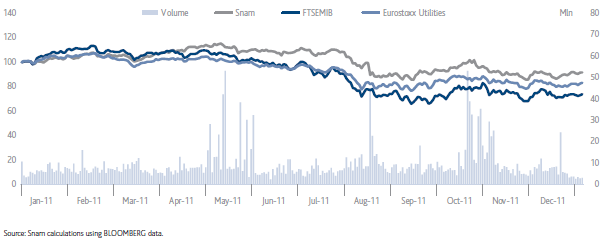
The Snam stock, which also features on the leading international indices (Stoxx Europe, S&P Europe, MSCI Europe) as well as the Italian FTSE MIB index, closed 2011 at an official price of €3.39, down 9.1% from the €3.73 recorded at the end of the previous year. The annual performance of the stock was not only affected by the negative trend of the financial markets in Italy and Europe, but also and especially by the extension of the application of the Robin Hood Tax in the second part of year to regulated national energy companies, which involved an increase in the tax rates.
During the year, the stock did however outperform the European utilities sector (Stoxx Europe 600 Utilities -16.6%), confirmation of the interest in companies with solid business fundamentals and long-term visibility of results and cash flows, in spite of increasing country risk and elevated volatility.
In 2011 the Italian MTA (Mercato Telematico Azionario) saw approximately 2.4 billion Snam shares change hands, with average daily exchanges of around 9.3 million shares, a fall compared to the 11.5 million of 2010.
Shareholders
At 31 December 2011, the fully subscribed and paid-up share capital of Snam Rete Gas S.p.A. totalled €3,571,187,994 and consisted of 3,571,187,994 ordinary shares with a nominal value of €1 (3,570,768,494 shares with the same nominal value at 31 December 2010). The increase of €355,000 over 31 December 2010 was due to the issue of 355,000 shares with a nominal value of €1, subscribed by executives entitled to participate in the 2003 and 2004 stock option plans.
At year end, based on entries in the Shareholders’ Register and other information gathered, Eni S.p.A. held 52.53% of share capital, Snam Rete Gas S.p.A. held 5.39% in the form of treasury shares in the portfolio, and the remaining 42.08% was held by other shareholders.
SNAM - COMPARISON OF PRICES OF SNAM, FTSE MIB
AND EURO STOXX 600 UTILITIES
(31 December 2010 - 31 December 2011)
SHAREHOLDER BASE OF SNAM BY TYPE OF INVESTOR
SNAM SHAREHOLDER BASE BY GEOGRAPHICAL AREA
KEY INDICES WHICH INCLUDE SNAM STOCK
FTSE MIB
Stoxx Europe 600
Stoxx Europe 600 Utilities
S&P Europe
SUSTAINABILITY INDICES
FTSE4Good Europe (as of 2002)
FTSE4Good Global (as of 2002)
DJSI World (as of 2009)
ECPI Ethical Europe (as of 2009)
ECPI Ethical Global (as of 2009)
ECPI Ethical EMU (as of 2009)
Stoxx Global ESG Leaders (as of 2011)


