Key figures
To improve the economic and financial review, in addition to conventional IAS/IFRS indicators and financial statements, the interim directors’ report also contains reclassified financial statements and several alternative performance indicators such as EBITDA, EBIT and net financial debt. The following tables, the explanatory notes thereto and the reclassified financial statements report these amounts; see the glossary for a definition of the terms used, where these are not specified.
| Download XLS (23 kB) |
|
Key financial figures |
|||||||
|
|
|
|
|
|
|
||
|
Financial |
|
First half |
Change |
% change |
|||
|
2014 |
(€ million) |
2014 |
2015 |
||||
|
|||||||
|
3,566 |
Total revenue |
1,782 |
1,837 |
55 |
3.1 |
||
|
3,506 |
- of which regulated |
1,748 |
1,796 |
48 |
2.7 |
||
|
790 |
354 |
403 |
49 |
13.8 |
|||
|
2,776 |
EBITDA |
1,428 |
1,434 |
6 |
0.4 |
||
|
1,973 |
EBIT |
1,044 |
1,012 |
(32) |
(3.1) |
||
|
1,198 |
Net profit (a) |
561 |
612 |
51 |
9.1 |
||
| Download XLS (23 kB) |
|
Key balance sheet and cash flow figures |
|||||
|
|
|
|
|
|
|
|
Financial |
|
First half |
Change |
% change |
|
|
2014 |
(€ million) |
2014 |
2015 |
||
|
1,313 |
Technical investments |
526 |
487 |
(39) |
(7.4) |
|
20,824 |
Net invested capital at period end |
19,786 |
20,889 |
1,103 |
5.6 |
|
7,172 |
Shareholders’ equity including minority interests at period end |
6,056 |
6,953 |
897 |
14.8 |
|
7,171 |
Shareholders’ equity attributable to the Group at period end |
6,055 |
6,952 |
897 |
14.8 |
|
13,652 |
Net financial debt at period end |
13,730 |
13,936 |
206 |
1.5 |
|
297 |
Free cash flow |
104 |
587 |
483 |
|
| Download XLS (23 kB) |
|
Key share figures |
||||||
|
|
|
|
|
|
|
|
|
Financial |
|
|
First half |
Change |
% change |
|
|
2014 |
|
|
2014 |
2015 |
||
|
3,500.6 |
Number of shares in share capital |
(millions) |
3,381.6 |
3,500.6 |
119.0 |
3.5 |
|
3,499.5 |
Number of shares outstanding at period end |
(millions) |
3,380.5 |
3,499.5 |
119.0 |
3.5 |
|
3,384.7 |
Average number of shares outstanding during the period |
(millions) |
3,380.3 |
3,499.5 |
119.2 |
3.5 |
|
4.11 |
Official share price at period end |
(€) |
4.41 |
4.30 |
(0.11) |
(2.5) |
| Download XLS (22 kB) |
|
Key profit indicators (a) |
|||||||
|
|
|
|
|
|
|
||
|
Financial |
|
First half |
Change |
% change |
|||
|
2014 |
|
2014 |
2015 |
||||
|
|||||||
|
0.583 |
EBIT per share |
0.309 |
0.289 |
(0.020) |
(6.5) |
||
|
0.354 |
Net profit per share |
0.166 |
0.175 |
0.009 |
5.4 |
||
| Download XLS (27 kB) |
|
Key operating figures (a) |
|||||||||||||||||||
|
|
|
|
|
|
|
||||||||||||||
|
Financial |
|
First half |
Change |
% change |
|||||||||||||||
|
2014 |
|
2014 |
2015 |
||||||||||||||||
|
|||||||||||||||||||
|
|
Natural gas transportation (b) |
|
|
|
|
||||||||||||||
|
62.28 |
Natural gas injected into the national gas transportation network (billions of cubic metres) (c) |
32.78 |
32.77 |
(0.01) |
(0.03) |
||||||||||||||
|
32,339 |
Gas transportation network (kilometres in use) |
32,303 |
32,354 |
51 |
0.2 |
||||||||||||||
|
893.9 |
Installed power in the compression stations (MW) |
890 |
853 |
(37) |
(4.2) |
||||||||||||||
|
|
Liquefied Natural Gas (LNG) regasification (b) |
|
|
|
|
||||||||||||||
|
0.01 |
LNG regasification (billions of cubic metres) |
0.002 |
0.020 |
0.018 |
|
||||||||||||||
|
|
Natural gas storage (b) |
|
|
|
|
||||||||||||||
|
11.4 |
Available storage capacity (billions of cubic metres) (d) |
11.4 |
11.4 |
|
|
||||||||||||||
|
15.70 |
Natural gas moved through the storage system (billions of cubic metres) |
9.51 |
11.96 |
2.45 |
25.8 |
||||||||||||||
|
|
Natural gas distribution (e) |
|
|
|
|
||||||||||||||
|
6.408 |
Active meters (millions) |
5.911 |
6.518 |
0.607 |
10.3 |
||||||||||||||
|
1,437 |
Gas distribution concessions (number) |
1,435 |
1,472 |
37 |
2.6 |
||||||||||||||
|
55,278 |
Distribution network (kilometres) (f) |
53,308 |
56,636 |
3,328 |
6.2 |
||||||||||||||
|
6,072 |
Employees in service at period end (number) (g) |
6,035 |
6,219 |
184 |
3.0 |
||||||||||||||
|
|
by business segment: |
|
|
|
|
||||||||||||||
|
1,874 |
- Transportation |
1,941 |
1,912 |
(29) |
(1.5) |
||||||||||||||
|
77 |
- Regasification |
80 |
75 |
(5) |
(6.3) |
||||||||||||||
|
291 |
- Storage |
308 |
287 |
(21) |
(6.8) |
||||||||||||||
|
3,124 |
- Distribution (e) |
3,001 |
3,221 |
220 |
7.3 |
||||||||||||||
|
706 |
- Corporate and other activities |
705 |
724 |
19 |
2.7 |
||||||||||||||
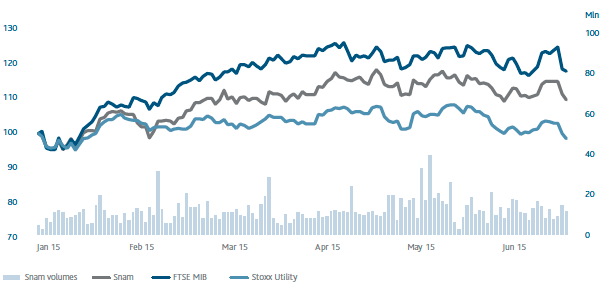
Snam and the financial markets
SNAM - COMPARISON OF PRICES OF SNAM SHARES, FTSE MIB AND STOXX EURO 600 UTILITIES
(1 JANUARY 2015 - 30 JUNE 2015)
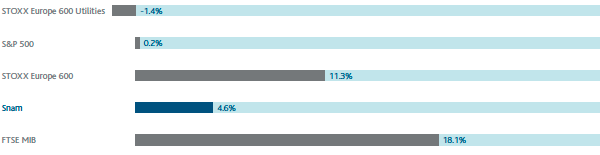
SNAM - COMPARISON OF SNAM’S PERFORMANCE WITH THE MAIN STOCK MARKET INDICES
(1 JANUARY 2015 - 30 JUNE 2015)
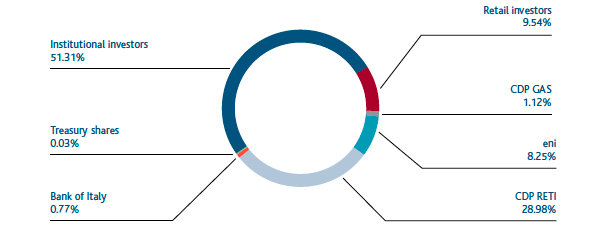
SNAM OWNERSHIP STRUCTURE BY TYPE OF INVESTOR
SNAM OWNERSHIP STRUCTURE BY REGION
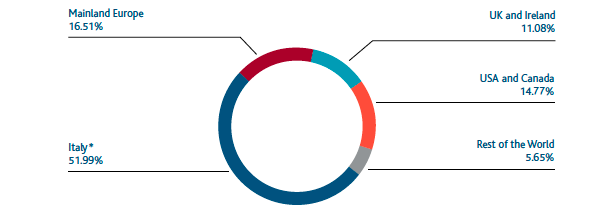
* The percentage for Italy includes the combined share of retail investors (9.54%) and treasury shares (0.03%), as well as the shareholdings of CDP RETI (28.98%), CDP GAS (1.12%) and eni (8.25%).