Since its listing on the Stock Exchange in 2001, Snam has always sought to maintain transparent relations with the financial community by expressly communicating its objectives and the results it has achieved.
To keep the quality of these consolidated reports high, each year all the benchmark best practices are adopted to allow shareholders and the financial market to fully evaluate the drivers for the creation of value at the Company. Among these, it is worth mentioning:
- roadshows (20 in 2011) aimed at meeting shareholders and institutional investors in the largest European and North American financial markets;
- one-to-one meetings between management and investors (140 in 2011, including about 15 at the San Donato Milanese site), in addition to which there are group meetings and sector conferences;
- conference calls at the time of disclosure of the corporate results (preliminary annual results, half-yearly and quarterly results), including analysts who publish research on the share.
| Download XLS (20 kB) |
|
KPI description |
KPI date |
Pre-set |
Target achieved |
Sector |
Activity |
|
Number of meetings with socially responsible investors out of total meetings (%) |
2010 |
Achieve 33% |
40 |
Snam group |
|
|
Increase the number of meetings with institutional investors (No.) |
2010 |
Hold 176 |
190 |
Snam group |
|
|
Hold Investor Day events |
2010 |
Hold 1 |
1 |
Snam group |
|
During 2011, management also took part in round-table meetings, seminars and conventions on subjects relating to the utilities industry, stock markets and corporate governance with specific presentations on these topics. These and all other information of interest to shareholders and investors, including the relaunch documentation and quarterly/half-yearly reports, both in Italian and in English, are available in the Investor Relations section on the corporate website, www.snam.it.
Performance of Snam shares

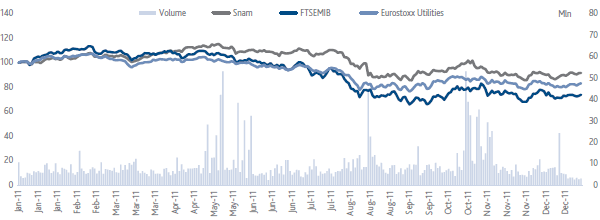
Snam’s stock, which is included in the FTSE MIB Italian index, and also in leading international indices (Stoxx Europe, S&P Europe and MSCI Europe), ended 2011 at an official price of €3.39, down 9.1% compared to the price of €3.73 recorded at the end of the previous year. The stock’s annual performance was affected not only by the abovementioned negative trend in Italian and European financial markets, but also, in particular, by the extension in the second half of the year of the “Robin Hood tax” to regulated companies in the Italian energy sector, which meant increased tax rates.
During the year, the stock nevertheless outperformed the trend in the European utilities sector (Stoxx Europe 600 Utilities: -16.6%), buoyed by interest, even in contexts of growing country risk and high volatility, in shares of companies with sound business fundamentals and long-term earnings and cash flow visibility.
In 2011, on the Borsa Italiana electronic stock exchange, around 2.4 billion Snam shares were traded, with average daily trading volumes of approximately 9.3 million shares, down from 11.5 million in 2010.


