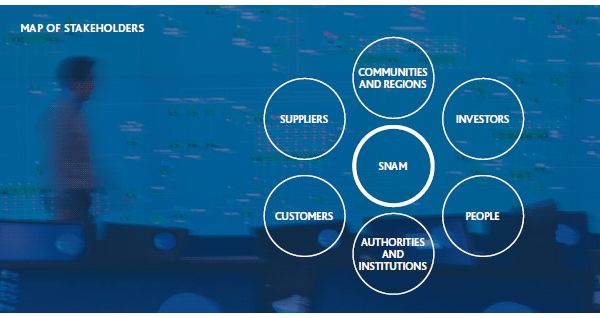
These relations are based on a corporate culture that has always sought to express the values of sustainability and corporate responsibility in the best possible way, to make them an integral part of strategic thinking and corporate management: they help to prevent and manage risks and, at the same time, can create value for stakeholders by taking practical action.
From this starting point, Snam has begun a review of its value creation processes, both for the company itself and for its stakeholders, focusing on a new way of expressing sustainability, innovative and diffused – a Sustainability 2.0 – that, with a proactive approach, can be an engine for value creation, responding to the Company’s development plans and the social and environmental requirements of the regions and communities in which it operates.
COMMUNICATIONS AND MEDIA
In the context of stakeholder relations, Snam’s communication and media presence play a key role that is relevant to all areas of business. Snam has a presence in all communication media, including new media, and aims to maintain an open, balanced and transparent approach and to offer valuable content.
In particular, in early 2012 the group completed a revamp of its web identity, putting nine fully upgraded internet sites online. The Company has continued to improve the usability of these sites and to offer maximum accessibility and transparency in terms of information on the holding company and the operating companies.
The high standard of the work done was recognised with the 2012 Interactive Award in the Energy category. Another significant result was achieved in the area of communication to financial stakeholders, with inclusion on the shortlist in the “major listed companies” category for the Oscar di Bilancio prize, created by FERPI (Federazione Relazioni Pubbliche Italia).
International prize for snam.it
The Interactive Media Council is a non-profit US organisation that rewards the best websites in the world in the respective categories, with the aim of promoting the adoption of standards of excellence.
With an overall score of 477 points out of a possible 500, Snam.it was named as best website in the world in its area of activity, for having shown “excellence in all criteria of judgement” according to the voting panel, including design, usability and innovation, and having achieved “a very high level of planning, execution and professionalism”.
In 2012 Snam was the subject of approximately 1,000 articles in the national press on various themes, the vast majority of which related to corporate development. The content and tone of these articles was judged to be positive and neutral in 98% of cases.
BREAKDOWN PRESS ARTICLES BY TOPIC (%)
2012 STAKEHOLDERS’ IDENTITY CARD
LA1-EC7
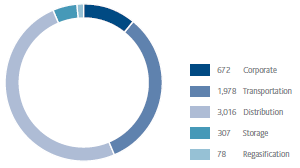
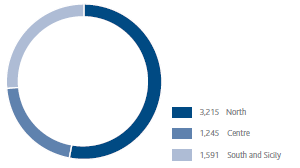
PEOPLE
Group staff: 6,051 (no)
Employees by activity (n.)
Distribution of employees by geographical area (n.)
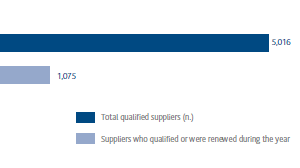
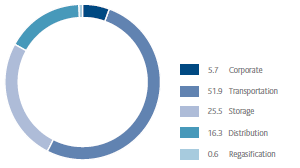
SUPPLIERS
Total qualified suppliers: 5,016 (no)
Breakdown of procurement (%)
€1.4 billion
CUSTOMERS
Customers (No.)
COMMUNITIES AND REGIONS
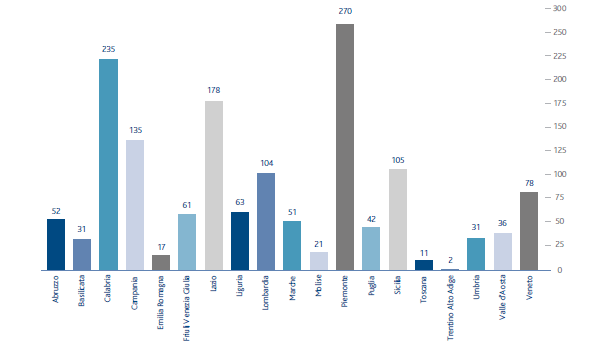
Snam group - local sites per region (No.)
INVESTORS
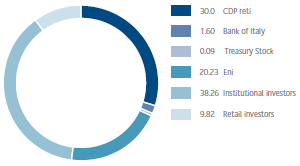
Shareholders structure (%)
Shareholding geographical breakdown (%)
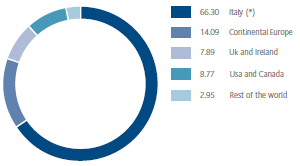
(*) The Italian percentile includes the total held by retail investors and treasury shares
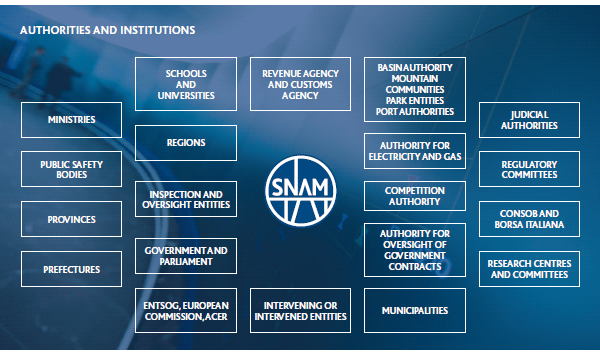
TOOLS FOR INVOLVING STAKEHOLDERS
| Download XLS (18 kB) |
|
Engagement tools |
People |
Institutional authorities |
Communities and local areas |
Customers |
Suppliers |
Investors |
|
Website |
Websites of all group companies with dedicated areas | |||||
|
Web areas |
Corporate Intranet |
|
|
Customer portals |
Supplier portal |
|
|
Institutional documents |
Annual Report – Sustainability Report – Report on Corporate Governance and Remuneration – | |||||
|
Media relations |
Press releases – Press conferences – Conferance calls - Interviews | |||||
|
Social Network |
Information and News | |||||
|
Newsletter |
Energy and special related issues |
|
|
|
|
Snam shareholder |
|
Survey |
Climate analysis |
|
|
Customer satisfaction |
Feedback questionnaires |
Rating questionnaires |
|
Meetings |
Managers’ meeting Cascade Project |
Institutional presentations |
Public meetings |
Workshops |
Workshops |
Road shows |
|
Awareness-raising campaigns |
Objective Safety project |
|
Clean up the world |
|
|
|
|
Plant tours |
Safety walk |
Open days |
|
|
| |
DISTRIBUTION OF ADDED VALUE
In 2012, Snam distributed to its stakeholders an overall amount of €2,261 million, corresponding to the sum of the added value produced (€2,195 million) and the resources drawn by the Company system (€66 million).
Of this amount, 26.23% was distributed to the government (€593 million), 37.37% to shareholders (€845 million), 18.66% to employees (€422 million) and 17.74% to lenders (€401 million).
The net overall added value was therefore distributed among different beneficiaries as follows: (i) employees (direct compensation comprising salaries, wages and post-employment benefits, and indirect compensation consisting of social security expenses, as well as costs for staff services (meal services, travel expense reimbursement, etc.)); (ii) government (income tax); (iii) lenders (interest on loan capital disbursements); and (iv) shareholders (dividends distributed).
EC1
GLOBAL ADDED VALUE (€ MILLION)
| Download XLS (16 kB) |
|
|
2010 |
2011 |
2012 | ||
| |||||
|
Core business revenue |
3,475 |
3,539 |
3,730 | ||
|
Other revenue and income |
33 |
66 |
216 | ||
|
Purchases, services and sundry expenses* |
596 |
631 |
760 | ||
|
Net financial expense |
120 |
88 |
431 | ||
|
Net income from equity investments |
47 |
51 |
55 | ||
|
Increases on internal works – Cost of work and financial expenses |
89 |
90 |
91 | ||
|
Gross global added value |
2,928 |
3,027 |
2,901 | ||
|
less - Amortisation, depreciation and impairment losses |
678 |
654 |
706 | ||
|
Net global added value |
2,250 |
2,373 |
2,195 | ||

