Results
For purposes of the 2016 consolidated financial statements, the separation from Snam of the natural gas distribution business, as a “separate major line of business of operations”, resulted in a separate representation, as discontinued operations, of financial results and cash flows in the natural gas distribution sector for the period 1 January – 6 November 2016, in accordance with IFRS 5 “Non-Current Assets Held for Sale and Discontinued Operations”. The financial years used for comparison were reclassified in a consistent manner. Consequently, this Report mainly shows and explains the results from continuing operations.
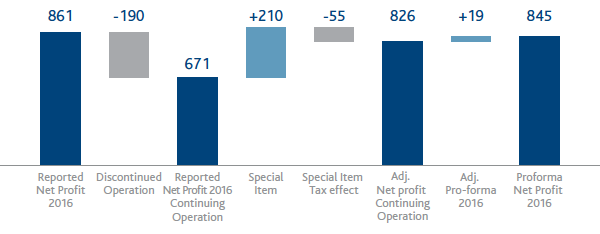
The 2016 financial year ended with a Group net profit, which includes the contribution from discontinued operations, of €861 million, a reduction of €377 million, representing a 30.5% reduction from the 2015 financial year. In consideration of the discontinuity factors that characterised the 2016 financial year, Snam’s management decided that the representation of results on an adjusted basis enables a better assessment of the performance of continuing operations and a greater comparability of data and information.
ADJUSTED OPERATING PROFIT
(millions of €)
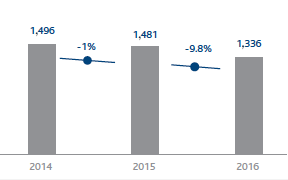
ADJUSTED OPERATING PROFIT - CONTINUING OPERATIONS
(millions of €)
Adjusted results for continuing operations10
Due to the soundness of operational management and rigorous financial discipline, in 2016 Snam achieved results that were in line with expectations, given the revision of the rate of return on invested capital for regulatory purposes (WACC) to be applied to 2016. Adjusted EBIT11 totalled €1,336 million, a reduction of €145 million, representing a 9.8% reduction from the 2015 financial year. The reduction mainly reflects the impacts on revenue from the revision of the WACC (-€114 million in total, -€134 million of which was the reduction posted in the transportation sector that was partly absorbed by the increase posted in the storage sector) and higher amortisation, depreciation and impairment losses (-€75 million, representing 13.0%) due mainly to the entry into service of new infrastructure and greater impairment losses of tangible assets.
In the instance of business sectors, the reduction in adjusted EBIT reflects transportation sector results (-12.4%; -€144 million), which were partly offset by the positive performance posted by the storage sector (+8.5%; +€27 million).
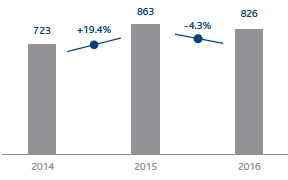
Adjusted net profit from continuing operations was €826 million, a reduction of €37 million (-4.3%) compared with the 2015 financial year. The reduction in the adjusted EBIT (-€145 million; -9.8%) was only partly offset by the significant improvement in financial management (+€69 million, representing 20.8%), which was mainly attributable to the reduction in average debt costs, as well as lower income taxes (+€29 million; representing 7.4%) due mainly to a lower pre-tax profit.
The pro-forma adjusted net income of the continuing operations, obtained by applying Snam’s share, amounting to 13.5%, to the estimated net income of Italgas Group for the whole of 2016, adjusted by excluding the effects resulting from the adjustment to market value of the existing financial debts towards Snam Group and eliminating the effects of non-recurring items from the valuation of foreign subsidiaries, amounts to €845 million.
ADJUSTED AND PRO-FORMA RESULTS (millions of €)
Net financial debt was €11,056 million as at 31 December 2016, compared with €13,779 million as at 31 December 2015. Cash flow from operating activities (€1,627 million), together with cash flow from divestments, mainly attributable to the consideration received for the transfer of the 38.87% equity investment in Italgas Reti S.p.A. (€1,502 million, net after transferred cash and cash equivalents), made it possible to fully finance requirements connected to technical investments, equity investments and financial assets instrumental to operating activities (€1,426 million in total) and to generate a free cash flow of €1,707 million. After outlays connected to equity cash flow (€978 million) and the effects of financial receivables with the Italgas Group, which resulted in a total reduction of €2,009 million in the financial position, net financial debt was reduced by €2,723, and was posted in the amount of €11,056.
Dividends
Thanks to its healthy results and solid business fundamentals, the Company will propose a dividend of €0.21 per share to the Shareholders’ Meeting, to be paid from 24 May 2017, confirming Snam’s commitment to an attractive and sustainable remuneration to its shareholders.
Key financial figures
To improve the economic and financial review, in addition to conventional IAS/IFRS indicators and financial statements, the Directors’ Report also contains reclassified financial statements and several alternative performance indicators such as EBITDA, EBIT, adjusted EBIT, adjusted net profit and net financial debt. The tables below, their explanatory notes and the reclassified financial statements describe how these amounts were determined. Unless otherwise specified, definitions of the terms used can be found in the glossary.
| Download XLS (20 kB) |
(€ million) |
2014 |
2015 |
2016 |
||||||
|
|||||||||
Continuing operations (a) |
|
|
|
||||||
Total revenue (b) |
2,578 |
2,627 |
2,560 |
||||||
- of which from regulated activities |
2,480 |
2,502 |
2,444 |
||||||
Operating costs (b) |
524 |
570 |
573 |
||||||
Adjusted EBIT (c) |
1,496 |
1,481 |
1,336 |
||||||
Adjusted net profit – continuing operations (c) (d) |
723 |
863 |
826 |
||||||
Adjusted net profit – discontinued operations (c) (d) |
355 |
346 |
190 |
||||||
Adjusted net profit (c) (d) |
1,078 |
1,209 |
1,016 |
||||||
Net profit – continuing operations (d) (e) |
692 |
796 |
591 |
||||||
Net profit – discontinued operations (d) (e) |
506 |
442 |
270 |
||||||
Net profit (d) (e) |
1,198 |
1,238 |
861 |
||||||
| Download XLS (19 kB) |
|
|
2014 |
2015 |
2016 |
||||||||
|
||||||||||||
Net profit per share – continuing operations (a) |
(€) |
0.204 |
0.227 |
0.169 |
||||||||
Adjusted net profit per share – continuing operations (a) |
(€) |
0.214 |
0.247 |
0.236 |
||||||||
Net profit per share (a) |
(€) |
0.354 |
0.354 |
0.246 |
||||||||
Adjusted net profit per share (a) |
(€) |
0.318 |
0.345 |
0.291 |
||||||||
Group shareholders’ equity per share (a) |
(€) |
2.12 |
2.17 |
1.86 |
||||||||
Pay-out (Dividends for the period/Group net profit) (b) (c) |
% |
73.0 |
70.7 |
83.86 |
||||||||
Adjusted pay-out (Dividends for the period/Group adjusted net profit) (b) (c) |
% |
81.2 |
72.4 |
71.06 |
||||||||
Dividend yield (Dividend for the period/year-end official share price) (b) (c) |
% |
6.1 |
5.2 |
5.4 |
||||||||
Price/Book value (Average official price per share/Group shareholders’ equity per share) (d) |
(€) |
2.00 |
2.08 |
2.21 |
||||||||
| Download XLS (17 kB) |
(€ million) |
2014 |
2015 |
2016 |
||
|
|||||
Technical investments |
1,313 |
1,272 |
1,199 |
||
- continuing operations |
954 |
879 |
906 |
||
- discontinued operations (*) |
359 |
393 |
293 |
||
Net invested capital at 31 December |
20,824 |
21,365 |
17,553 |
||
Shareholders’ equity including minority interests at 31 December |
7,172 |
7,586 |
6,497 |
||
Group shareholders’ equity at 31 December |
7,171 |
7,585 |
6,497 |
||
Net financial debt at 31 December |
13,652 |
13,779 |
11,056 |
||
Free cash flow |
297 |
771 |
1,707 |
||
| Download XLS (20 kB) |
|
|
2014 |
2015 |
2016 |
||||||||
|
||||||||||||
Number of shares of share capital |
(million) |
3,500.60 |
3,500.60 |
3,500.6 |
||||||||
Number of shares outstanding at 31 December |
(million) |
3,499.50 |
3,499.50 |
3,470.7 |
||||||||
Average number of shares outstanding during the year |
(million) |
3,384.70 |
3,499.50 |
3,496.8 |
||||||||
Year-end official share price (a) |
(€) |
3,396 |
4,002 |
3,923 |
||||||||
Average official share price during the period (a) |
(€) |
3,488 |
3.721 |
4.101 |
||||||||
Market capitalisation (b) |
(million) |
14,383 |
16,973 |
13,612 |
||||||||
Dividend per share |
(€ per share) |
0.25 |
0.25 |
0.21 |
||||||||
Dividends per period (c) |
(million) |
875 |
875 |
722 |
||||||||
Dividends paid in the period (d) |
(million) |
507 |
875 |
875 |
||||||||
Breakdown of added value
At Snam, sustainability and the creation of value are strongly connected concepts. Sustainability creates value for the Company and stakeholders, and establishes a connection between the business and corporate social responsibility. The Company produces wealth by contributing to the economic growth of the society and environment in which it operates, and it measures this wealth in terms of added value produced and distributed to its key stakeholders.
Snam calculates the added value taking inspiration from the standard prepared by the Gruppo di Studio per il Bilancio Sociale (GBS) and the GRI – G4 guidelines.
The table below is useful for understanding the Group’s economic impact and makes it possible to read the consolidated financial statements from the standpoint of stakeholders.
For this purpose, note that the calculation of the added value in 2016 was made restoring the eliminations that originated from transactions involving discontinued operations to continuing operations for each single income statement item. The values for the comparison years have been recalculated accordingly.
In 2016, the gross global added value produced by Snam was equal to €2,518 million, an increase of €89 million compared with 2015 (€2,429 million), in spite of the reduction in the net invested capital remuneration rate – WACC provided by the Authority for 2016 which affected the operational profitability of natural gas transportation activities.
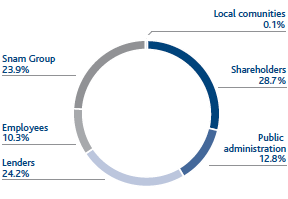
A total of 23.9% of the gross global added value produced by Snam was reinvested within the Group (in line compared with 2015: -0.7%), and intended essentially for the amortisation and depreciation of the intangible and tangible fixed assets used in the production process. With regard to the main reference stakeholders, in 2016 the percentage of added value distributed to employees was stable (10.3%; +0.5% compared with 2015), through direct remuneration composed of wages, salaries and severance pay and indirect remuneration composed of social security contributions and staff-related service costs (canteen services, reimbursement of travel expenses), while there was a reduction in the value destined for the Public Administration through the payment of direct and indirect taxes (12.8%; -2.4% compared with 2015), due to the reduction in the pre-tax result in 2016, as well as a reduction in the value distributed to shareholders through the dividends distributed (28.7%; -7.3% compared with 2015) in consideration of the Italgas separation transaction and by way of the lower number of outstanding shares following the buyback of treasury shares by Snam under the share buyback programme launched in November 2016. With reference to the value distributed to funders, equal to 24.2%, there was an increase of 9.9% compared with 2015 as a result of the bond buyback operation implemented by Snam in 2016. Lastly, an amount of approximately €2 million was designated for local communities (0.1% of the value generated) through donations and sponsorship initiatives (€0.8 million) and environmental compensation pursuant to the law (€1.2 million).
DISTRIBUTION OF ADDED VALUE (GRI: G4-EC1)
10 The EBIT and net profit on an adjusted basis are not result measures required by the IFRS. Those performance measures (Non-GAAP measures) were determined by excluding special items and, in order to remove the distorting effects generated by the application of IFRS 5, restoring in the results from continuing operations intercompany transactions vis-à-vis discontinued operations, in order to achieve a representation of the results from continuing operations as if discontinued operations had been removed from the consolidation area. In order to determine the EBIT and adjusted net profit and for reconciliation with the respective reported results, see the Chapter “Financial review – Reconciliation of EBIT and net profit with adjusted EBIT and adjusted net profit” of this Report.
11 EBIT was analysed by isolating only the elements that resulted in a change to that figure. To this end, applying gas sector tariff regulations generates revenue components that are offset in costs. Those components mainly pertained to natural gas interconnections and transfers carried out for purposes of balancing the gas system