Market benchmarks and pay mix
The guidelines are prepared and the policies implemented are assessed with the support of independent and highly specialised advisors, and using specific salary benchmarking (Hay, Mercer, Towers Watson).
The remuneration benchmarks used for different types of positions are indicated in the table below:
| Download XLS (23 kB) |
|
Hay |
Mercer |
Tower Watson |
CEO |
Executives, large industrial companies (n. 84) |
Panel of listed Italian companies comparable to Snam in terms of capitalisation and/or turnover (26) |
Panel of companies comparable to Snam in terms of turnover, capitalisation, employees, complexity of business and/or stock exchange segment (14) |
Chairman |
|
Panel of listed Italian companies comparable to Snam in terms of capitalisation and/or turnover (17) |
|
COO |
|
|
Panel of companies comparable to Snam in terms of turnover, capitalisation, employees, complexity of business and/or stock exchange segment (14) |
Managers with strategic responsibilities |
Executives, large industrial companies (84) |
|
|
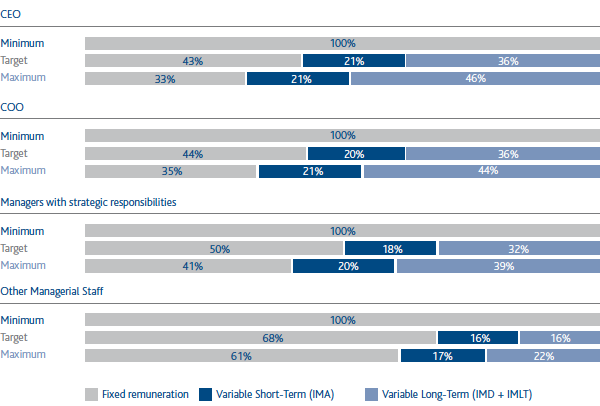
The 2016 Remuneration Policy guidelines call for a pay mix in line with the managerial position held, with greater weighting for the variable component for posts typically having a greater impact on corporate results, as shown in the pay-mix chart set out below and calculated considering the enhancement of short- and long-term incentives in the event of on-target results, in terms of a minimum level (non-achievement of the threshold value specified in all short- and long-term variable incentive plans) and a maximum level.