WITHDRAWALS OF NATURAL GAS
| Download XLS (17 kB) |
|
(billions of m3) |
2010 |
2011 |
2012 |
Change |
% change | ||||
| |||||||||
|
Redelivery to the domestic market |
81.54 |
76.69 |
73.49 |
(3.20) |
(4.2) | ||||
|
Exports and transit (*) |
0.54 |
0.42 |
0.38 |
(0.04) |
(9.5) | ||||
|
Consumption and emissions attributable to Snam Rete Gas |
0.47 |
0.27 |
0.27 |
|
| ||||
|
Gas not accounted for and other changes (**) |
0.12 |
0.03 |
0.13 |
0.10 |
| ||||
|
Total withdrawals of natural gas |
82.67 |
77.41 |
74.27 |
(3.14) |
(4.1) | ||||
The natural gas withdrawn from the National Transportation Network in 2012 (74.27 billion cubic metres) is mainly: (i) for redelivery to users at the network exit points (73.49 billion cubic metres); (ii) exports and transit (0.38 billion cubic metres), mainly to Slovenia; and (iii) consumption by the compression stations and the gas emissions from the network and from Snam Rete Gas plants (0.27 billion cubic metres).
RECONCILIATION OF THE QUANTITIES OF GAS WITHDRAWN FROM THE NETWORK AND ITALIAN DEMAND
| Download XLS (17 kB) |
|
(billions of m3) |
2010 |
2011(*) |
2012 |
Change |
% change (**) | ||||||
| |||||||||||
|
Quantities withdrawn |
82.67 |
77.41 |
74.27 |
(3.14) |
(4.1) | ||||||
|
Exports (-) |
(0.54) |
(0.42) |
(0.38) |
0.04 |
(9.5) | ||||||
|
Gas injected into the regional networks of other operators |
0.06 |
0.06 |
0.05 |
(0.01) |
(2.6) | ||||||
|
Other consumption (***) |
0.91 |
0.87 |
0.97 |
0.10 |
11.5 | ||||||
|
Total Italian demand |
83.10 |
77.92 |
74.91 |
(3.01) |
(3.9) | ||||||
DEMAND FOR GAS IN ITALY
| Download XLS (17 kB) |
|
(billions of m3) |
2010 |
2011(*) |
2012 |
Change |
% change (**) | ||||||||
| |||||||||||||
|
Residential and tertiary |
33.91 |
30.82 |
31.19 |
0.37 |
1.2 | ||||||||
|
Thermoelectric |
30.06 |
28.21 |
25.11 |
(3.10) |
(11.1) | ||||||||
|
Industrial (***) |
17.36 |
17.04 |
16.63 |
(0.41) |
(2.3) | ||||||||
|
Other (****) |
1.77 |
1.85 |
1.98 |
0.13 |
7.1 | ||||||||
|
|
83.10 |
77.92 |
74.91 |
(3.01) |
(3.9) | ||||||||
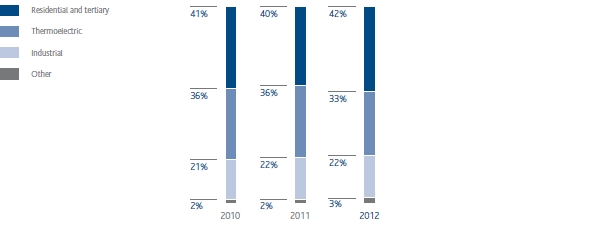
Gas demand in Italy in 2012 was 74.91 billion cubic metres, down by 3.01 billion cubic metres (-3.9%) compared with 2011. This fall was due to lower consumption in the thermoelectric (-11.1%) and industrial (-2.3%) sectors, offset in part by higher consumption in the residential and tertiary sector (+1.2%) as a result of weather conditions.
Adjusted for weather effect, natural gas demand decreased by 5.8% compared with 2011.
GAS DEMAND BY SECTOR
(% of total gas demand)
TRANSPORTATION CAPACITY
| Download XLS (17 kB) |
|
(billions of m3/day) |
Thermal year 2010-2011 |
Thermal year 2011-2012 |
Thermal year 2012-2013 | ||||||
|
Entry points |
Trans- |
Capacity |
Satu- |
Trans- |
Capacity |
Satur- |
Trans- |
Capacity |
Satur- |
|
Tarvisio |
119.2 |
110.3 |
92.5 |
118.8 |
109.9 |
92.5 |
116.8 |
107.9 |
92.4 |
|
Mazara del Vallo |
105.0 |
98.9 |
94.2 |
105.0 |
88.2 |
84.0 |
105.0 |
86.7 |
82.6 |
|
Gries Pass |
64.8 |
55.0 |
84.9 |
64.4 |
61.7 |
95.8 |
64.4 |
61.6 |
95.7 |
|
Gela |
35.2 |
34.3 |
97.4 |
37.6 |
21.9 |
58.2 |
37.6 |
30.6 |
81.4 |
|
Cavarzere (LNG) |
26.4 |
24.6 |
93.2 |
26.4 |
24.6 |
93.2 |
26.4 |
21.0 |
79.5 |
|
Panigaglia (LNG) |
13.0 |
7.2 |
55.4 |
13.0 |
11.4 |
87.7 |
13.0 |
11.0 |
84.6 |
|
Gorizia |
4.8 |
0.5 |
10.4 |
4.8 |
0.6 |
12.5 |
4.8 |
0.1 |
2.1 |
|
|
368.4 |
330.8 |
89.8 |
370.0 |
318.3 |
86.0 |
368 |
318.9 |
86.7 |
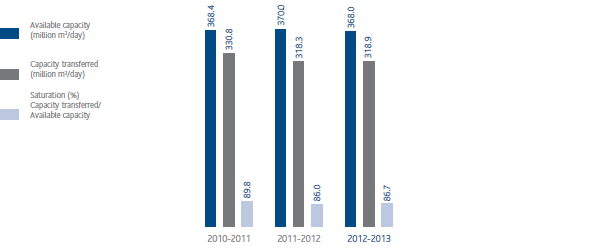
The transportation capacity of the network has also covered the entire demand of users for the thermal year 2012-2013. Transportation capacity at the start of thermal year 2012-2013 was 368 million cubic metres per day. The new entry point at Livorno was also created in the thermal year, and its capacity is subject to the conferment request pursuant to Resolution 168/06 of the Electricity and Gas Authority and to the Decree of the Ministry of Economic Development of 24 November 2010. In addition to the above capacities relating to entry points connected with LNG terminals and foreign countries, transportation capacity is also available at entry points connected with domestic production. Domestic production also has access to transportation capacity that is modulated over the year (two periods have been introduced: summer and winter), in order to increase transportation capacity in winter.
Snam Rete Gas has prepared a long-term plan for transportation capacity, which was sent to the Ministry of Economic Development on 29 June 2012 and published on the Business & Services section of the Snam Rete Gas website www.snamretegas.it.
Lastly, ISO 9001 certification has been renewed for the transportation capacity definition process.


