AVAILABILITY OF NATURAL GAS
| Download XLS (16 kB) |
|
(billions of m3) |
2009 |
2010 (*) |
2011 |
Change |
Change % | ||||
| |||||||||
|
From imports |
68.67 |
75.17 |
70.27 |
(4.90) |
(6.5) | ||||
|
Domestic output |
8.23 |
8.14 |
8.03 |
(0.11) |
(1.4) | ||||
|
Total gas injected into the network |
76.90 |
83.31 |
78.30 |
(5.01) |
(6.0) | ||||
|
Net balance of withdrawal/introduction into storage (**) |
0.78 |
(0.64) |
(0.89) |
(0.25) |
39.1 | ||||
|
Total availability of natural gas |
77.68 |
82.67 |
77.41 |
(5.26) |
(6.4) | ||||
WITHDRAWALS OF NATURAL GAS
| Download XLS (17 kB) |
|
(billions of m3) |
2009 |
2010 (*) |
2011 |
Change |
Change % | ||||
| |||||||||
|
Redelivery to the domestic market |
76.66 |
81.54 |
76.69 |
(4.85) |
(5.9) | ||||
|
Exports |
0.48 |
0.54 |
0.42 |
(0.12) |
(22.2) | ||||
|
Consumption and emissions attributable to Snam Rete Gas |
0.34 |
0.47 |
0.27 |
(0.20) |
(42.6) | ||||
|
Gas not accounted for and other changes (**) |
0.20 |
0.12 |
0.03 |
(0.09) |
(75.0) | ||||
|
Total withdrawals of natural gas |
77.68 |
82.67 |
77.41 |
(5.26) |
(6.4) | ||||
The availability of natural gas in Italy in 2011 was 77.41 billion cubic metres, down by 5.26 billion cubic metres (-6.4%) compared to 2010.
The quantities of gas injected into the National Transportation Network was down by 6.0% to 78.30 billion cubic metres (83.31 billion cubic metres in 2010), through the effect of the lower imports (-4.90 billion cubic metres; -6.5%), as well as the reduction of national production (-0.11 billion cubic metres; -1.4%).
The analysis of imports by entry point is:
IMPORTS BY ENTRY POINT
| Download XLS (16 kB) |
|
(billions of m3) |
2009 |
2010 |
2011 |
Change |
Change % |
|
Entry points |
|
|
|
|
|
|
Tarvisio |
22.92 |
22.49 |
26.45 |
3.96 |
17.6 |
|
Mazara del Vallo |
21.66 |
26.29 |
21.55 |
(4.74) |
(18.0) |
|
Gries Pass |
12.02 |
7.83 |
10.86 |
3.03 |
38.7 |
|
Cavarzere (LNG) |
1.53 |
7.04 |
7.02 |
(0.02) |
(0.3) |
|
Gela |
9.17 |
9.41 |
2.34 |
(7.07) |
(75.1) |
|
Panigaglia (LNG) |
1.32 |
1.98 |
1.89 |
(0.09) |
(4.5) |
|
Gorizia |
0.05 |
0.13 |
0.16 |
0.03 |
23.1 |
|
|
68.67 |
75.17 |
70.27 |
(4.90) |
(6.5) |
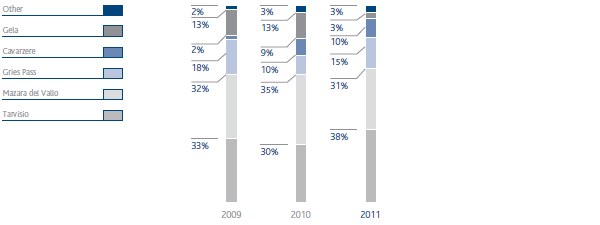
Imports (70.27 billion cubic metres) recorded a reduction of 6.5% from 2010. Specifically, the lower volumes injected from the Gela entry point (-7.07 billion cubic metres; -75.1%), following the effects of the Libyan crisis, and Mazara del Vallo (-4.74 billion cubic metres; -18.0%), set against an increase in imports from the entry point of Tarvisio (+3.96 billion cubic metres; +17.6%) and Gries Pass (+3.03 billion cubic metres; +38.7%) penalised in 2010 by the break, in Switzerland, in the import line which connects Italy with Northern Europe.
NATURAL GAS INJECTED INTO THE NETWORK BY ENTRY POINT
(% the total introduced)
VOLUMES OF NATURAL GAS INJECTED INTO THE NETWORK PER USER
| Download XLS (16 kB) |
|
(billions of m3) |
2009 |
2010 (*) |
2011 |
Change |
Change % | ||
| |||||||
|
Eni |
39.58 |
35.45 |
35.12 |
(0.33) |
(0.9) | ||
|
Enel Trade |
8.65 |
10.34 |
9.34 |
(1.00) |
(9.7) | ||
|
Other |
28.67 |
37.52 |
33.84 |
(3.68) |
(9.8) | ||
|
|
76.90 |
83.31 |
78.30 |
(5.01) |
(6.0) | ||


