GREENHOUSE GASES
EN26
The greenhouse gases (GHG) emitted into the atmosphere by the activities of Snam are carbon dioxide (CO2) and methane (CH4), the main component of natural gas. CO2 is produced in combustion processes and is directly correlated with fuel consumption, while emissions of natural gas, and thus CH4, derive partly from normal plant operation and partly from discharges into the atmosphere caused by new pipeline connection works or maintenance works, or by accidents on the transportation and distribution networks.
In addition to using natural gas as its main fuel, Snam attempts to minimise GHG emissions in its operating activities by employing specific containment programmes, such as:
- the reduction of natural gas emissions (through the recompression of gas in pipelines, the replacement of pneumatic equipment and the replacement of cast-iron pipes in distribution networks);
- the reduction of power consumption (using specific energy management measures);
- the use of electricity produced from renewable energy sources (through specific purchase contracts and the installation of photovoltaic panels).
The advantages of natural gas
At equal energy usage, the carbon dioxide produced by the combustion of natural gas is 25-30% less than petroleum products and 40-50% less than coal. The decrease in emissions per unit of energy produced is further accentuated by the possibility of using natural gas in high-performance applications and technologies, such as condensation boilers, co-generation plants and combined cycles for producing electricity. A gas-powered combined cycle with output of 56-58%, compared with output of about 40% from traditional steam-powered cycles, makes it possible to reduce CO2 emissions by 52% compared with a traditional fuel oil-powered plant and by 62% compared with a coal-powered plant.
2012 GHG EMISSIONS
")
EN16
In 2012, total GHG emissions (direct and indirect – Scope 2 were approximately 2.27 million tonnes (unchanged from 2011). The trend of CO2 emissions from combustion depends greatly on the plans and requests of the customers to which Snam provides transportation, storage, regasification and distribution services.
TOTAL GHG EMISSIONS (103 t)
")
EN18
In order to contain natural gas emissions from the transportation network, activities were continued which involve gas recovery through in-line gas recompression interventions in the network upgrading phase (13 interventions were carried out, recovering 5.4 million cubic metres of natural gas, an increase on the 11 interventions and 4.4 million cubic metres recovered in 2011), as well as the replacement of pneumatic equipment at some plants. As regards containing natural gas emissions in distribution networks, the Company continued to replace cast-iron piping with more high-performance piping (replacing about 85 km of networks).
The value of natural gas recovered in 2012 meant a reduction of more than 84,100 tonnes in CO2eq atmospheric emissions.
NATURAL GAS EMISSIONS RECOVERY TRANSPORTATION
|
EMISSIONS AVOIDED
|
")
")
In 2012, natural gas emissions rose by about 1.5 million cubic metres compared with 2011, going from 96.9 million cubic metres to 98.4 million cubic metres (+1.6%). This increase was due mainly to gas transportation network emergencies in 2012 (2.8 million cubic metres). Without those exceptional events, emissions would have been lower than in 2011.
KEY PERFORMANCE INDICATORS (KPI)
| Download XLS (19 kB) |
|
KPI description |
KPI date |
Pre-set |
Target achieved |
Sector |
Activity | ||
| |||||||
|
Natural gas recovered out of total potential emissions from maintenance activities |
2010 |
Recover 30% in 2012 |
49% |
Transportation |
| ||
|
Replacement of |
2010 |
Replace the entire grey cast-iron network* by 2014 |
172 |
Distribution |
| ||
|
Natural gas emissions as a proportion of gas injected into the network |
2008 |
Reach a percentage of 0.048% in 2012 |
0.055% |
Transportation |
| ||
The “Natural gas emissions as a proportion of gas injected transportation” KPI, which was set in 2008 for 2012, was not achieved. This is because of higher natural gas emissions caused by emergencies and lower volumes of gas injected into the network.
DIRECT EMISSIONS
EN16
Direct CO2 emissions from combustion stood at approximately 691,870 tonnes (in line with 2011), while CO2-eq emissions deriving from methane emissions were approximately 1.5 million tonnes (also in line with 2011). The CO2-eq emissions were calculated based on a global warming potential (GWP) of 25 for methane, as indicated in the 2007 scientific study of the Intergovernmental Panel on Climate Change (IPCC), “IPCC Fourth Assessment Report”.
DIRECT CO2 EMISSIONS
|
TOTAL DIRECT
|
")
")
INDIRECT EMISSIONS (SCOPE 2)
EN16-EN17
Indirect CO2-eq emissions derive from the use of electricity. In 2012, they stood at approximately 40,660 tonnes (+13% compared to 2011). This increase is due to higher electricity consumption by distribution activities and to full-year accounting of the energy consumption of the data processing centre, started in the second half of last year.
Indirect CO2-eq emissions have been calculated with a national average factor of 0.483 kg CO2 /KWh.
INDIRECT EMISSIONS CO2eq (103 t)
")
By way of agreements concluded during the year, Snam will procure more electricity from renewable sources in the 2013-2014 two-year period. Specifically, the compression station at Messina (Snam Rete Gas) will join its counterpart at Brugherio (Stogit) and the regasification plant at Panigaglia (GNL Italia) in procuring its electricity in this way. It is estimated that this will reduce the Snam group’s total CO2-eq emissions by 36%.
INDIRECT EMISSIONS (SCOPE 3)
EN16-EN17
Scope 3 indirect emissions refer to GHGs related to the supply chain (the provision of goods and services from third parties) and to business travel (business trips of Snam employees).
In 2012, CO2-eq emissions from business travel alone were approximately 2,840 tonnes (+27% compared with 2011). This increase was due to more rail and air trips, partly owing to the new activities that Snam is involved in at European level.
With regard to supply chain emissions reporting, Snam launched a dedicated project at the start of 2013 with one of the world’s leading carbon footprint analysis companies.
INDIRECT EMISSIONS BUSINESS TRAVEL -
SCOPE 3 (t CO2eq)
")
EMISSIONS TRADING
EC2-EN16
The Snam plants falling under the scope of application of the Emissions Trading Directive as at 31 December 2012 are shown in the table:
| Download XLS (15 kB) |
|
Company |
ET plants (no) |
Name |
|
Snam Rete Gas |
12 |
Gas compression stations in Enna, Gallese, Istrana, Malborghetto, Masera, Melizzano, Messina, Montesano, Poggio Renatico, Tarsia, Terranuova Bracciolini and the Mazara del Vallo entry point terminal. |
|
Stogit |
7 |
Gas compression storage stations in Cortemaggiore, Fiume Treste, Minerbio, Ripalta, Sabbioncello, Sergnano and Settala. |
|
GNL Italia |
1 |
Liquefied natural gas regasification plant in Panigaglia. |
In 2012, the CO2 emissions verified and certified by an accredited entity, in accordance with the provisions issued by the relevant national authority, stood at 607,148 tonnes, out of a total of 1,001,577 annual quotas allocated by the Ministry of the Environment, Land and Sea (a positive balance of 394,429 quotas).
Before the emissions trading regulations on climate change came into force, Snam had already undertaken initiatives to contain emissions using high-yield technologies and natural gas as the main fossil fuel in its plants. Natural gas is used almost exclusively as fuel in the emissions trading plants.
ENERGY CONSUMPTION
EN4
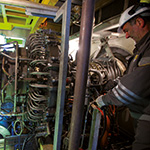
The company’s main energy consumption is due to gas turbines – used in compression stations to provide gas with the pressure necessary for transportation (compression gas) or storage (storage consumption) – and to the evaporators used at the Panigaglia LNG regasification plant.
EN7
To limit energy consumption, the best available technologies have always been used and high-performance turbines have been installed. In particular, the fuel consumption of the compression stations is controlled by the Dispatching Centre through the use of software systems which make it possible to manage the transportation network as efficiently as possible, in keeping with transportation and storage needs, with an optimal configuration of the individual compression stations.
EN3
In 2012, total energy consumption was around 12,801 TJ, in line with 2011. The energy source most used was natural gas, which covered 95.1% of total energy needs. The other sources used were electricity (3.3%), other fossil fuels (diesel oil, petrol, LPG) and heat (1.6%).
EN5ENERGY CONSUMPTION (TJ) |
EN1-EN3ENERGY CONSUMPTION (%) |
")
")
EN7
In energy management, the company continued activities aimed at identifying possible energy consumption rationalisation and containment actions, such as the installation of photovoltaic equipment in buildings and plants, the adoption of LED lights and automatic switches for plant lighting, the installation of more efficient heat generators, the implementation of videoconferencing services to limit travel, and more efficient management of the movement of merchandise to and from the central warehouse.
KEY PERFORMANCE INDICATORS (KPI)
| Download XLS (17 kB) |
|
KPI description |
KPI date |
Pre-set |
Target achieved |
Sector |
Activity Status | ||
| |||||||
|
High-efficiency turbines |
2010 |
Achieve 85% out of total units installed by 2015 |
70 |
Storage |
| ||
|
High-efficiency turbines* |
2010 |
Achieve 72% out of total units installed by 2015 |
93 |
Transportation |
| ||

Italgas energy certification
Energy efficiency is one of the main aspects to consider as we try to reach our targets on reducing primary energy consumption and CO2 emissions and move more towards renewable sources.
In 2012, Italgas’s energy management system was found to be in compliance with ISO 50001 standards, which is the first time that a Snam group company or any Italian network services company has received energy certification.
ISO 50001 requires energy efficiency to be promoted throughout the business chain, and it also requires the development of an initial energy analysis, the determination of baselines and the identification of energy performance indicators. We have also appointed an energy management team to ensure that the energy management system is functional and up to date, and to make suggestions for energy improvements and interventions.
Our energy analyses have assessed the various energy uses of Italgas, which include: the efficient use of heat generators to heat gas; office buildings; company vehicles; new electricity generation plants with photovoltaic facilities; and natural gas emissions.
In this first stage, certification applies to the industrial gas distribution infrastructures, but we aim to extend it to the use of energy in civic structures such as offices and buildings not connected to gas distribution.
Two areas of intervention in particular have been identified for specific energy-saving activities in relation to the current certification. These are:
• reducing energy consumption at gas withdrawal and reduction stations by installing a system for distributing flows more evenly;
• replacing grey cast-iron pipeline sections with materials with lower specific emissions (PE/steel).
Our considerable progress is proof of the group’s commitment to managing its processes in a controlled fashion, while continually focusing on health, safety, environmental, quality and now energy-saving issues.
PRODUCTION AND USE OF ENERGY FROM RENEWABLE SOURCES
EN3-EN6
Being aware of the importance of using energy from renewable sources, the Company has begun programmes that involve the installation of photovoltaic facilities in buildings that it owns (local headquarters and maintenance centres) and in some natural gas withdrawal and pressure reduction stations in the distribution network.
| Download XLS (15 kB) |
|
Renewable source plants |
Number |
Total capacity (kW) |
Energy produced (kWh) |
|
Wind generators |
1 |
1.5 |
143,542 |
|
Impianti Fotovoltaici |
1.699 |
454,6 |
The number of renewable-source plants increased from 1,685 in 2011 to 1,700 in 2012 (+0.9%). The total installed capacity of these plants increased substantially, however, from 231 kW in 2011 to 456 kW in 2012 (+97%). This increase is due to the fact that in 2012 we installed 11 20-kW photovoltaic plants for transportation and two 5-kW plants for distribution activities.
The total energy produced by renewable-source plants fell slightly compared with 2011, going from about 156,000 kWh to around 144,000 kWh (-8%). This reduction is due to the fact that the new facilities installed in 2012 were still not connected to the network, meaning their energy contribution was invalid, while a malfunction partially impeded energy production at two existing plants.

