PROTECTING THE AIR
EN20
The use of natural gas as its principal energy source enables the company to minimise emissions of sulphur oxides and particulate matter.
Nitrogen oxide (NOx) emissions, the only significant polluting emissions, derive from the use of the gas turbines installed in compression stations (compression and storage) and of the evaporators at the liquefied natural gas regasification plant.
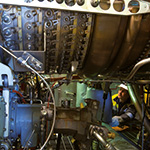
In order to reduce nitrogen oxide emissions deriving from the combustion of natural gas in the gas turbines used in compression stations, in recent years some existing turbines were modified and new units installed with dry low emission (DLE) combustion systems, while at the regasification plant, submerged flame evaporators are used.
In 2012, programmes for upgrading station turbines were continued. Specifically, DLE transformations were completed for the turbines at Settala (TC1) and Sabbioncello (TC1).
TOTAL NOX EMISSIONS (t)
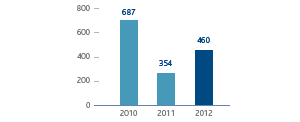
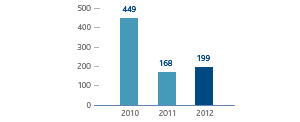
Total emissions of nitrogen oxides were around 985 tonnes (+7% compared with 2011). This slight increase was due mainly to more storage activity and to less use (for operational reasons) of the DLE turbines in transportation activities than in 2011.
NOx emissions into the atmosphere are determined based on direct measurements or, if these are not available, on emission factors present in the relevant literature (the EMEP/EEA Air Pollutant Emission Inventory Guidebook).
During the year, we updated the continuous emissions monitoring systems (CEMS) of the turbocompressors at the Ripalta and Sergnano storage centres.
KEY PERFORMANCE INDICATORS (KPI)
| Download XLS (18 kB) |
|
KPI description |
KPI date |
Pre-set target |
Target achieved in 2012 |
Sector |
Activity | ||
| |||||||
|
No of DLE turbines out of total no of turbines |
2010 |
Achieve 75% by 2015 |
72 |
Transportation |
| ||
|
No of DLE turbines out of total no of turbines* |
2010 |
Achieve 85% by 2015 |
45 |
Storage |
| ||
|
Rated NOx emissions on turbine installed capacity |
2010 |
Achieve |
5.9 |
Transportation |
| ||
|
Rated NOx emissions on turbine installed capacity |
2010 |
Achieve 6 mg/(Nm3*MW) by 2015. |
13.6 |
Storage |
| ||
|
No of hours of operation of DLE turbines out of total hours of operation of turbines |
2010 |
Achieve 85% by 2015 |
75 |
Transportation |
| ||
WASTE MANAGEMENT
The waste that Snam produces can be traced mainly to three areas of activity: production, site reclamation and well drilling.
Waste from production activities has always been a relatively insignificant environmental factor in terms of both the quantity and the type of waste. The waste generated derives mainly from the maintenance and management of the plants, and the majority of it consists of ferrous materials which are recovered in full.
Waste from reclamation activities results from the environmental requalification of 28 areas, with a total buildable area of around 137 hectares, contaminated as a result of earlier industrial activities, mainly due to the production of manufactured gas. Reclamation waste can also be produced during the laying of pipelines through contaminated sites not owned by Snam in which it must operate.
Waste deriving from well drilling consists mainly of slurries typically produced in some phases of the storage activity.
EN22
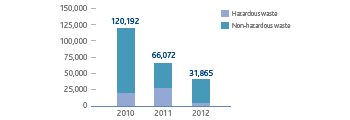
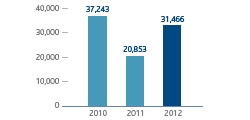
Total waste production was approximately 31,865 tonnes in 2012, down by 52% compared with the previous year. Of this, 95% was non-hazardous waste and 5% was hazardous waste. In total, 47% of the waste disposed was sent for recovery.
The reduction in waste produced is due almost exclusively to reclamation activities, which in 2012 involved only water drainage operations that produced practically no waste. The waste produced in 2012 derived almost exclusively (99% of the total) from production activities.
WASTE
|
WASTE BY
|
EN2
Ecologically
The project “Ecologically”, started in 2010, continued. This includes initiatives aimed at promoting good eco-sustainable practices even in the office, with small daily gestures that help to improve the quality of the surrounding environment.
“All paper recycled” means making all personnel at all group sites aware of the advantages of using recycled paper, whilst raising awareness of environmental protection issues.
In 2012 the use of recycled paper with respect to total paper bought was 38%, allowing the group to save natural resources and control carbon dioxide emissions.
| Download XLS (15 kB) |
|
Trees (n.) |
Water (million litres) |
Electricity (kWh) |
CO2 eq.(t) |
|
- 1,110 |
- 32,6 |
- 364,700 |
- 180 |
WATER
Water procurement and discharge in the activities of Snam represents a relatively insignificant environmental factor, in terms of both the quantities used and the type of discharges.
EN1-EN8-EN9
In 2012, approximately 4.46 million cubic metres of water were procured (4 million of sea water and 0.46 million of fresh water). The procurement of sea water was practically unchanged compared with 2011, while that of fresh water increased slightly.
EN9
Sea water is used for cooling auxiliary equipment in the LNG regasification plant, and fresh water is used primarily for office activities, fire-fighting apparatus and the irrigation of green spaces.
EN10
With regard to water discharges, the sea water consumed for cooling is released into the sea as is, without any treatment, while the waste water is channelled into the sewage networks (91% of the total) or discharged, after treatment, into the soil and into surface water bodies (9% of the total).
To control the discharge of domestic waste water, we continued to investigate the possibility of installing new closed-cycle phyto-purification plants at corporate sites away from the sewage networks. These phyto-purification plants eliminate discharge since waste water is treated and fully absorbed by planted vegetation following the separation of settleable solids. As a result of this analysis, we drew up plans to build two new plants, starting in 2013.
EN21
In the storage business, in the upstream phase, approximately 3,285 cubic metres of process water were produced. Of this water, about 1,525 cubic metres were reinjected as is, while the rest (about 1,760 cubic metres) was sent to a purification plant for treatment.
FRESH WATER
|
FRESH WATER
|
MANAGEMENT OF SUBSTANCES HARMFUL TO THE OZONE LAYER
EN19
The initiatives in progress concern the monitoring and control of all conditioning plants containing substances harmful to the ozone layer in order to check for any leaks of gas into the atmosphere. These substances can be found, in modest quantities, in a limited number of plants, and a programme is under way to replace them with ecological fluids. In 2012, around 157 kg of HCFCs were replaced with ecological fluids. The most recent analysis of all Snam plants shows that around 1,600 kg still needs to be disposed of.
RESTRICTING NOISE EMISSIONS
SO1
For the restriction of noise emissions, Snam implements a prevention policy which consists of correct plant sizing in the design phase, accompanied by the conducting of a noise impact forecast.
The main sources of noise are the gas compression stations (transportation and storage), generally located in rural areas, the pressure reduction and regulation plants that link pipelines with different operating pressures, and the LNG regasification plant.
The principal control measures adopted include the installation of soundproofed cabins, noise-reducing hoods, low-noise valves, silencers on operating vents, and the burial of pipes.
In 2012, for purposes of mitigating noise emissions from facilities through technological adaptations, actions continued for improving the acoustic soundproofing of plants in the gas transportation and distribution network. In particular, in the transportation network, 44 interventions were carried out on gas pressure reduction and regulation cabins (9 in 2010 and 45 in 2011), in accordance with plans providing for interventions at a total of 120 plants by 2013, while in the distribution network, the monitoring of noise emissions, with consequent managerial and/or plant-related interventions, involved 316 plants.

