Greenhouse gases
EN26
The greenhouse gases (GHG) emitted into the atmosphere by the activities of Snam are carbon dioxide (CO2) and methane (CH4), the main component of natural gas. CO2 is produced in combustion processes and is directly correlated with fuel consumption, while emissions of natural gas, and thus CH4, derive partly from normal plant operation and partly from discharges into the atmosphere caused by new pipeline connection works or maintenance works, or by accidents on the transportation and distribution networks.
In addition to using natural gas as its main fuel, Snam attempts to minimise emissions of GHG in its operating activities by employing specific containment programmes, such as:
- the reduction of natural gas emissions (through the recompression of gas in pipelines, the replacement of pneumatic equipment and the replacement of cast-iron pipes in distribution networks);
- the reduction of power consumption (using specific energy management measures);
- the use of electricity produced from renewable energy sources (through specific purchase contracts and the installation of photovoltaic panels)
2011 GHG EMISSIONS
EN16
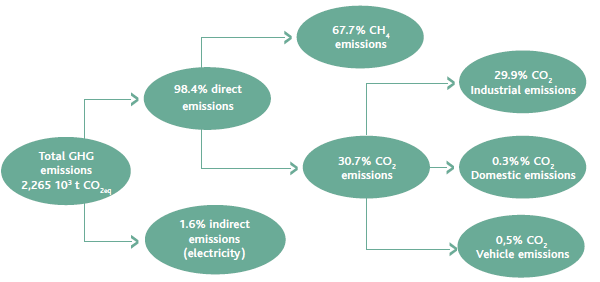
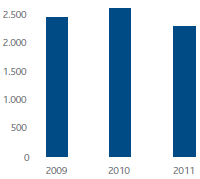
In 2011, total GHG emissions (direct and indirect) were approximately 2.26 million tonnes (-16% compared to 2010). This reduction is attributable to both a decrease in energy consumption and the initiatives undertaken to reduce natural gas emissions. The trend of CO2 emissions from combustion depends greatly on the plans and requests of the customers to which Snam provides transportation, storage, regasification and distribution services.
EN18
In order to contain natural gas emissions from the transportation network, activities were continued which involve gas recovery through online gas recompression interventions in the network upgrading phase (11 interventions were carried out, recovering 4.4 million cubic metres of natural gas), as well as the replacement of pneumatic equipment at some plants.

As regards containing natural gas emissions in civic distribution networks, activities were continued involving replacing iron piping with more high-performance piping (replacing about 136 km of networks). In 2011, natural gas emissions were reduced by about 4 million cubic metres compared to 2010, going from 100.8 million cubic metres to 96.9 million cubic metres (-3.9%).
| Download XLS (20 kB) |
|
KPI description |
KPI date |
Pre-set |
Target achieved |
Sector |
Activity |
|
Natural gas recovered out of total potential emissions from maintenance activities |
2010 |
Recover 30% in 2011 |
42.7% |
Transportation |
|
|
Replacement of iron networks |
2010 |
Replace 400 km by 2014 |
136 |
Distribution |
|
|
Natural gas emissions as a proportion of gas injected into the network |
2008 |
Reach a percentage of 0.048% in 2012 |
0.051% |
Transportation |
|
TOTAL GHG EMISSIONs (103t)
The advantages of natural gas
At equal energy usage, the carbon dioxide produced by the combustion of natural gas is 25-30% less than petroleum products and 40-50% less than coal. The decrease in emissions per unit of energy produced is further accentuated by the possibility of using natural gas in high-performance applications and technologies, such as condensation boilers, co-generation plants and combined cycles for producing electricity. A gas-powered combined cycle with output of 56-58%, compared to output of about 40% from traditional steam-powered cycles, makes it possible to reduce CO2 emissions by 52% compared to a traditional oil-powered plant and by 62% compared to a coal-powered plant.
Direct emissions
EN16
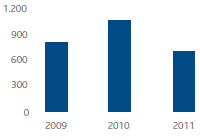
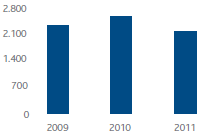
Direct CO2 emissions from combustion stood at approximately 694,530 tonnes (-34% compared to 2010), while CO2eq emissions deriving from methane emissions were approximately 1.5 million tonnes (-2.8% compared to 2010). The CO2eq emissions were calculated based on a global warming potential (GWP) of 25 for methane, as indicated in the scientific study of the Intergovernmental Panel on Climate Change (IPCC), “IPCC Fourth Assessment Report of 2007”.
DIRECT CO2 EMISSIONS FROM COMBUSTION (103t) |
TOTAL DIRECT CO2eq EMISSIONS (103t) |
 |
 |
Indirect emissions
EN16-EN17
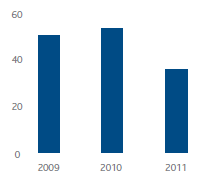
Indirect CO2eq emissions derive from the use of electricity. In 2011, they stood at approximately 36,040 tonnes (-35% compared to 2010). The reduction in emissions is the result of a series of initiatives, started in 2010, aimed at increasing the use of electricity produced exclusively from renewable sources. These initiatives primarily concerned two plants high in electricity consumption (the LNG regasification plant and the Brugherio storage station, which is equipped with electric motors). The indirect CO2eq emissions were calculated based on a national average factor of 0.483 kgCO2/KWh.
INDIRECT CO2eq EMISSIONS (103t)
Emission Trading
EC2-EN16
The Snam plants falling under the scope of application of the Emissions Trading Directive as at 31 December 2011 are shown in the table:
| Download XLS (19 kB) |
|
Company |
E.T. plants (No.) |
Name |
|
Snam Rete Gas |
12 |
Gas compression stations in Enna, Gallese, Istrana, Malborghetto, Masera, Melizzano, Messina, Montesano, Poggio Renatico, Tarsia, Terranuova Bracciolini and the Mazara del Vallo entry point terminal |
|
Stogit |
7 |
Gas compression storage stations in Cortemaggiore, Fiume Treste, Minerbio, Ripalta, Sabbioncello, Sergnano and Settala. |
|
GNL Italia |
1 |
Liquefied natural gas regasification plant in Panigaglia |
In 2011, the CO2 emissions verified and certified by an accredited entity, in accordance with the provisions issued by the relevant national authority, stood at 611,367 tonnes, out of a total of 1,001,577 annual quotas allocated by the Ministry of Environment and Protection of Land and Sea (a positive balance of 390,210 quotas).
Before the emissions trading regulations on climate change came into force, Snam had already undertaken initiatives to contain emissions using high-yield technologies and natural gas as the main fossil fuel in its plants. Natural gas is used almost exclusively as fuel in the emissions trading plants.
Energy consumption
EN4
The Company’s main energy consumption is due to gas turbines – used in compression stations to provide gas with the pressure necessary for transportation (compression gas) or storage (storage consumption) – and due to the vaporisers used at the Panigaglia plant to regasify liquefied natural gas (LNG).
EN7
To limit energy consumption, the best available technologies are used and high-performance turbines have been installed. In particular, the fuel consumption of the compression stations is controlled by the Dispatching department through the use of software systems which make it possible to manage the transportation network as efficiently as possible, in keeping with transportation and storage needs, with an optimal configuration of the individual compression stations.
ENERGY CONSUMPTION (TJ) |
ENERGY CONSUMPTION (%) |
 |
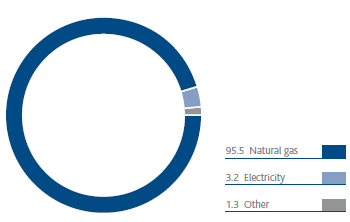 |
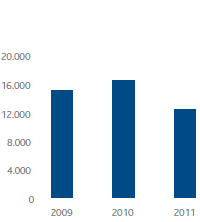
In 2011, total energy consumption was around 12,830 TJ. The energy source most used was natural gas, which covered around 95% of total energy needs. The other sources used were electricity (3.2%) and other fossil fuels (diesel oil, petrol, LPG) and heat (1.3%).
EN5
Energy consumption in 2011 decreased by 33% compared to the previous year. This decrease is due mainly to the reduction in gas injected into the transportation network by customers and to a different breakdown of gas transported, which saw a drastic reduction compared to 2010 in gas injected on the North African backbone (-33%), conditions which have led to decreased use of the gas compression stations. Added to these operational factors are the initiatives implemented by the Company to contain energy consumption.
EN7
In energy management, the Company continued activities aimed at identifying possible energy consumption rationalisation and containment actions, such as the installation of photovoltaic equipment in buildings and plants, the adoption of LED lights and automatic switches for plant lighting, the installation of more efficient heat generators, the implementation of videoconferencing services to limit travel, and more efficient management of the movement of merchandise to and from the central warehouse.
| Download XLS (20 kB) |
|
KPI description |
KPI date |
Pre-set |
Target achieved |
Sector |
Activity Status |
|
High-efficiency turbines |
2010 |
Achieve 72% out of total units installed by 2015 |
67.4% |
Transportation |
|
|
High-efficiency turbines |
2010 |
Achieve 85% out of total units installed by 2015 |
65.2% |
Storage |
|
Production and use of energy from renewable sources
EN3-EN6
Aware of the importance of using energy from renewable sources, the Company has begun programmes that involve the installation of small photovoltaic plants in buildings that it owns (local sites and maintenance centres) and some plants in the distribution network for withdrawing and reducing the pressure of natural gas.
| Download XLS (19 kB) |
|
Renewable source plants |
Number |
Total capacity (kW) |
Energy Produced (kWh) |
|
Wind generators |
1 |
1.5 |
156,548 |
|
Photovoltaic plants |
1,684 |
229.5 |
Renewable source plants increased from 1,642 in 2010 to 1,685 in 2011 (+2.6%). In line with this increase, the total installed capacity of the plants increased, going from 226 kW in 2010 to 231 kW in 2011 (+2.3%). These increases were due mainly to the installation of new photovoltaic plants over the course of the year in the distribution business.
The total energy produced by renewable source plants increased considerably in 2011, going from about 111,000 kWh in 2010 to about 156,000 kWh (+41%). The increase in energy produced is attributable to the photovoltaic equipment installed in 2010 at company buildings and which were connected to the distribution network during the year.


