Snam and the financial markets

In 2015, European equity markets continued to be highly volatile. The first half of the year saw a sharp rise supported by expectations, by the ECB announcement of quantitative easing and an overall improvement in the economic cycle. This was followed by the second half of the year with an overall retreat of equity indices due at first to the possible exit of Greece from the single currency, and then to fears of a global slowdown resulting from Chinese macroeconomic data below expectations and the continuing drop in the price for crude oil and other commodities, which put several emerging countries that export raw materials into a recession.
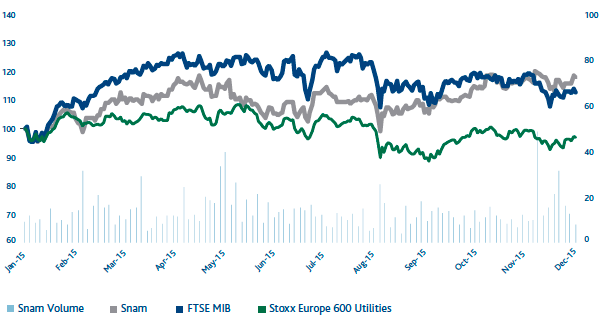
The Stoxx Europe 600 index ended 2015 with a 6.8% increase over the end of 2014, while in terms of domestic indices, the best performance was reported by the FTSE MIB, which was up by 12.7% based on expectations of a recovery of the Italian economy after years of crisis. Despite the positive performance of regulated securities, the Stoxx Europe 600 Utilities index ended 2015 down 3.7% due to the weak performance of securities of integrated companies, resulting from the reduction in electricity prices brought about by the decrease in prices for energy raw materials.
The ECB purchase programme resulted in a compression of the BTP-BUND spread from about 135 bps at the beginning of 2015 to about 97 bps at the end of the same year, although the yield of the BUND remained essentially unchanged. On the other hand, the quantitative easing programme, which largely focused on sovereign securities, produced a larger spread relative to corporate yields.
Snam share performance
The Snam share price closed 2015 at an official price of €4.848, up 17.8% from the €4.114 recorded at the end of the previous year. The stock appreciated in value almost continually during the entire year, driven initially by the overall rise in equity markets and the contraction in sovereign yields. Later, prices were bolstered by improved expectations concerning the revision in the return recognised on invested capital for regulatory purposes and by the attractive dividend yield and the business’s defensive profile. In 2015 the stock hit a historical high of €4.93 on 3 December.
Around 3.3 billion Snam shares were traded on Borsa Italiana’s electronic market (MTA) in 2015, with an average of 13.1 million shares traded daily, an increase over the average of 10.2 million reported in 2014.
SNAM – Comparison of prices of Snam, FTSE MIB and STOXX Europe 600 Utilities
(1 January 2015 – 31 December 2015)
Shareholders
The share capital as at 31 December 2015 consisted of 3,500,638,294 shares with no indication of nominal value (unchanged from 31 December 2014), with a total value of €3,696,851,994 (unchanged from 31 December 2014).
As at 31 December 2015, Snam held 1,127,250 treasury shares (the same number as at 31 December 2014), equal to 0.03% of its share capital, with a book value of about €5 million.
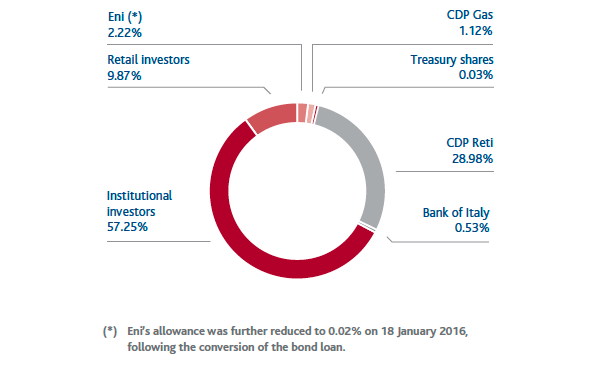
At year end, based on entries in the Shareholders’ Register and other information gathered, CDP Reti S.p.A. held 28.98% of share capital, Eni S.p.A. held 2.22%9, CDP Gas S.r.l. held 1.12%, Snam S.p.A. held 0.03% in the form of treasury shares, and the remaining 67.65% was in the hands of other shareholders.
COMPOSITION OF SNAM SHAREHOLDERS
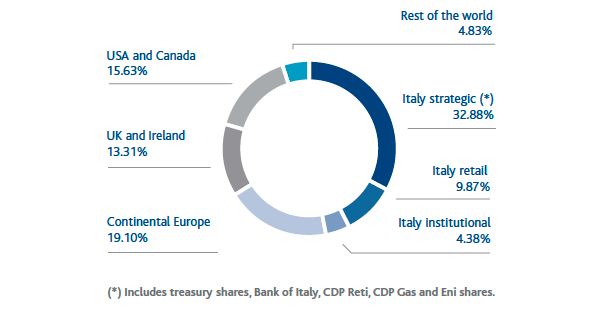
SNAM OWNERSHIP STRUCTURE BY REGION
Snam’s communications policy has always focused on an ongoing dialogue with the entire financial community. The company’s goal is to establish a relationship of trust with shareholders, investors, analysts and all financial market operators, and to provide them with regular, complete and prompt information to ensure an excellent understanding of the Group’s performance and strategy.
An active policy of engaging investors, supported by clear and transparent communications, contributes to the enhancement of the Company’s reputation, and Snam considers this a strategic factor in creating value in terms of shareholder satisfaction, understanding their expectations concerning corporate governance and enhancing the knowledge of all stakeholders who are called upon to make decisions that impact the Company.
This communications policy takes the form of many economic and financial publications concerning business performance and sustainability developments, in addition to ongoing meetings and events, which throughout 2015 included the following:
- 19 roadshows to meet shareholders and institutional investors in the major financial centres of Europe and North America;
- 7 industry conferences allowing investors specialising in the utilities and infrastructure sectors to meet the Company’s senior management;
- 108 one-to-one meetings between management and investors, in addition to numerous group meetings (42);
- conference calls upon the publication of the Company’s results (annual, semi-annual and quarterly) and the presentation of the Business Plan.
Inclusion of Snam stock in sustainability indices
In 2015, for the seventh consecutive year, Snam stock was again included by RobecoSAM (one of the most important sustainability rating agencies at global level) in the Dow Jones Sustainability World Index, the main international equity index formed on the basis of the performance of companies in the area of economic, social and environmental sustainability.
In January 2016, for the second consecutive year, RobecoSAM placed Snam in the Silver Class of the Sustainability Yearbook 2016, a distinguished group of companies, which in the industrial sector concerned includes companies with a high score in terms of sustainability.
Further confirmation came from a prestigious number of FTSE4Good indices, in which the company has been included since 2002, and for the third consecutive year, from the CDP Italy Climate Disclosure Leadership Index, a sustainability index. In July 2015, for the second consecutive year, Snam stock was again included in the two indices MSCI World ESG and MSCI ACWI ESG.
Snam stock is also included in the following sustainability indices:
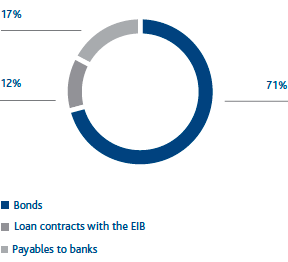
Debt management and credit rating
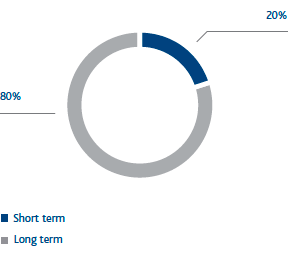
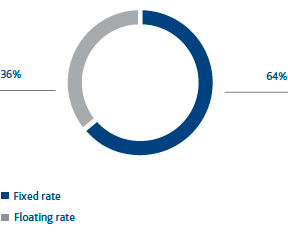
At 31 December 2015, the Group’s net financial position was €13,779 million, resulting from financial debt of €13,796 million and liquid assets of €17 million. Snam’s goal is to achieve a debt structure consistent with business requirements in terms of loan term and interest rate exposure.
In 2015, the strategy of optimising the Group’s financial structure continued through the renegotiation of the terms of a syndicated loan totalling €3.2 billion.
With regard to the capital market, in November 2015, Snam successfully completed a liability management transaction involving the repurchase of outstanding fixed-rate bonds with an average remaining maturity of under two years for a total nominal value of around €1.0 billion, and the concurrent issuance of a new fixed-rate bond with a term of eight years totalling €0.75 billion.
This transaction made it possible to optimise medium- and long-term debt maturities by extending their average term and creating conditions for a reduction in average borrowing costs.
In addition, the EIB made three loans to Snam to fund projects promoted by Snam Rete Gas (€573 million) and Italgas (€124 million). Loans with the EIB fall under the Group’s policy to optimise its financial structure since they complement bonds and bank loans and have longer terms (up to 20 years) and competitive costs.
At 31 December 2015, Snam had unused long-term committed credit lines totalling around €3.95 billion, in addition to the amount available (€2.3 billion) in terms of bond issues under the Euro Medium Term Note programme (EMTN).
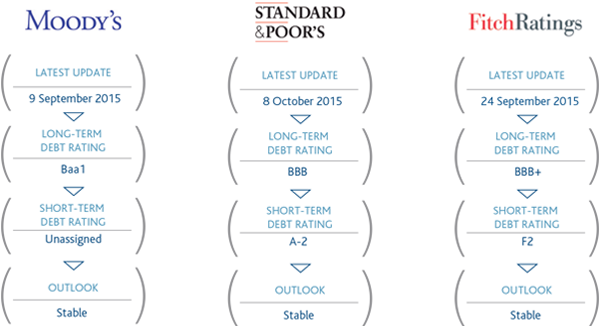
At the same time, the Group continued to work with the rating agencies Standard & Poor’s and Moody’s and maintained its “investment grade” credit rating from Moody’s (Baa1) and Standard & Poor’s (BBB), both with a stable outlook.
In addition, on 23 July 2015 the Fitch rating agency assigned Snam a rating of BBB+ with a stable outlook.
Snam’s long-term rating by Moody’s and Standard & Poor’s is a notch higher than that of Italian sovereign debt.
9 As at 18 January 2016, the maturity date of the Eni bond convertible to Snam shares, which was placed in December 2013, Eni S.p.A. held 792,619 ordinary Snam shares, equal to 0.02% of share capital, resulting in an increase in minority interests, which at that date totalled 69.85%.