Liquefied Natural Gas (LNG) regasification
LNG Italia plays a key role in ensuring adequate diversification and flexibility of supplies to the gas system
17,500 m3
Daily regasification capacity maximum of LNG of the plant in Panigaglia
3.5 bn m3
Maximum annual quantity of natural gas that can be released into the network for transmission
2.40 bn m3
Quantity of LNG regasified in 2019 in Panigaglia (1.49 bn m3 in 2018)
The Panigaglia plant, built in 1971 and owned by LNG Italia, is able to regasify 17,500 m³ of LNG every day; under conditions of maximum efficiency, it can supply more than 3.5 billion cubic metres of natural gas into the transport network every year.
The total amount of gas regasified at the Panigaglia plant in 2019 was 2.40 billion m³ (0.91 billion m³ in 2018; +1.49 billion m³).
The significant increase in volumes of activities compared with last year, is mainly due to the greater competitiveness of the cost of LNG compared with natural gas, as well as the new regasification capacity allocation mechanisms through dedicated auctions.
In 2019 57 methane tankers were unloaded (+36 compared with 2018).
The new capacity allocation mechanisms based on auctions as well as the new businesses in the SSLNG sector, linked specifically to the possible future uses in heavy transport and maritime transport, will lead to a scenario of further growth in the consumption of LNG in future years.
Methane ship trends
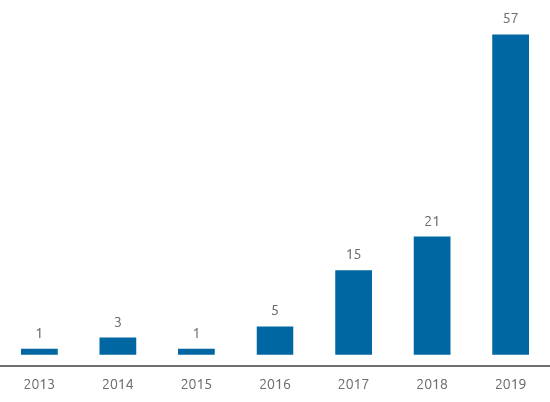
57
(+36% compared with 2018) Methane tanker loads

The regasification service can be continuous for the entire thermal year or the spot type. Moreover, from October 2018 the regasification capacity was awarded through dedicated auctions. Lastly, the regasification service includes the ancillary service, which consists of correcting the heating power of the natural gas to comply with quality requirements for its injection into the transportation network (correction of the Wobbe index).
During the course of 2019, LNG Italia provided regasification services to 6 active customers (2 customers in 2018).
| Download XLS (22 kB) |
(millions of €) |
2017 |
2018 |
2019 |
Change |
% change |
||||||||
|---|---|---|---|---|---|---|---|---|---|---|---|---|---|
|
|||||||||||||
Total revenue (a) |
22 |
24 |
32 |
8 |
33.3 |
||||||||
- of which regulated revenues (a) |
21 |
20 |
27 |
7 |
35.0 |
||||||||
Total revenues net of pass-through items (a) |
19 |
21 |
22 |
1 |
4.8 |
||||||||
Operating costs (a) |
15 |
17 |
26 |
9 |
52.9 |
||||||||
Operating costs net of pass-through items (a) |
12 |
14 |
16 |
2 |
14.3 |
||||||||
EBIT |
2 |
2 |
1 |
(1) |
(50.0) |
||||||||
Technical investments (b) |
5 |
9 |
19 |
10 |
|
||||||||
Net invested capital at 31 December |
89 |
86 |
95 |
9 |
10.5 |
||||||||
Volumes of regasified LNG (billions of cubic metres) (c) (d) |
0.63 |
0.91 |
2.40 |
1.49 |
|
||||||||
Tanker loads (number) |
15 |
21 |
57 |
36 |
|
||||||||
Employees in service at 31 December (number) |
63 |
64 |
65 |
1 |
1.6 |
||||||||