Injections and withdrawals from the transportation network
In 2019, a total of 75.37 billion cubic metres of gas was injected into the network, an increase of 2.55 billion cubic metres (+3.5%) compared with 2018.
Injections into the network from domestic production fields or their collection and treatment centres totalled 4.51 billion cubic metres, down by 0.61 billion cubic metres (-11.9%) compared with 2018.
Volumes injected at entry points connected with other countries and with regasification plants, overall equal to 70.86 billion cubic metres, rose by 3.16 billion cubic metres (+4.7%) compared with 2018.
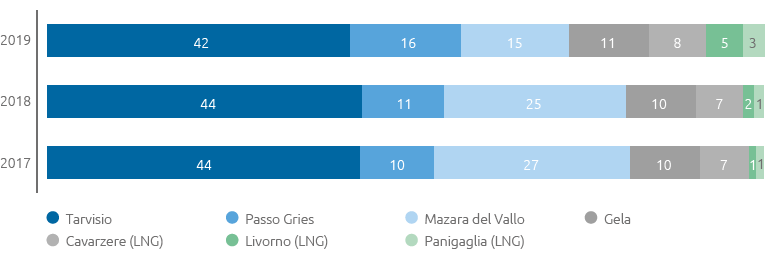
The greater volumes injected by the LNG regasification terminals (+5.29 billion cubic metres or +61.1%), also thanks to the new auction-based capacity allocation mechanisms, as well as the entry points of Passo Gries (+3.37 billion cubic metres or +43.4%) and Gela (+1.23 billion cubic metres or +27.5%), partly offset by lower volumes injected by the entry point Mazara del Vallo (-6.88 billion cubic metres or -40.3%).
Natural gas injected into the a by import point (% of total gas injected)
| Download XLS (21 kB) |
(billions of m3) |
2017 |
2018 |
2019 |
Change |
% change |
||||
|---|---|---|---|---|---|---|---|---|---|
|
|||||||||
Redelivery to the domestic market |
73.97 |
71.48 |
73.03 |
1.55 |
2.2 |
||||
Exports and transit (*) |
0.33 |
0.45 |
0.38 |
(0.07) |
(15.6) |
||||
Consumption and emissions attributable to Snam Rete Gas |
0.28 |
0.27 |
0.23 |
(0.04) |
(14.8) |
||||
Gas not accounted for and other changes (**) |
0.24 |
0.19 |
0.34 |
0.15 |
78.9 |
||||
Total withdrawals of natural gas |
74.82 |
72.39 |
73.98 |
1.59 |
2.2 |
||||
The natural gas withdrawn from the National Transportation Network in 2019 (73.98 billion cubic metres) is mainly: (i) redelivery to users at network exit points (73.03 billion cubic metres; +2.2%); (ii) exports and transit (0.38 billion cubic metres or -15.6%); and (iii) consumption by the compression stations and gas emissions from the network and from Snam Rete Gas plants (0.23 billion cubic metres or -14.8%).
| Download XLS (23 kB) |
(billions of m3) |
2017 |
2018 (a) |
2019 |
Change |
% change (b) |
||||||||||
|---|---|---|---|---|---|---|---|---|---|---|---|---|---|---|---|
|
|||||||||||||||
Total gas injected into the network |
74.59 |
72.82 |
75.37 |
2.55 |
3.5 |
||||||||||
Net balance of withdrawal/injection into storage (c) |
0.23 |
(0.43) |
(1.39) |
(0.96) |
|
||||||||||
Total withdrawals of natural gas |
74.82 |
72.39 |
73.98 |
1.59 |
2.2 |
||||||||||
Exports (-) (d) |
(0.33) |
(0.45) |
(0.38) |
0.07 |
(15.6) |
||||||||||
Gas injected into the regional networks of other operators |
0.03 |
0.03 |
0.03 |
|
|
||||||||||
Other consumption (e) |
0.63 |
0.69 |
0.71 |
0.02 |
2.9 |
||||||||||
Total Italian demand |
75.15 |
72.66 |
74.34 |
1.68 |
2.3 |
||||||||||
| Download XLS (24 kB) |
(millions of m3/day) |
Calendar year 2017 |
Calendar year 2018 |
Calendar year 2019 |
||||||||||
|---|---|---|---|---|---|---|---|---|---|---|---|---|---|
|
|||||||||||||
Entry points |
Transportation capacity |
Allocated capacity |
Saturation (%) |
Transportation capacity |
Allocated capacity |
Saturation (%) |
Transportation capacity |
Allocated capacity |
Saturation (%) |
||||
Tarvisio (**) |
111.4 |
94.6 |
84.9 |
111.1 |
107.4 |
96.7 |
110.6 |
98.3 |
88.9 |
||||
Mazara del Vallo (*) (**) |
84.4 |
78.3 |
92.8 |
82.0 |
81.2 |
99.0 |
86.7 |
36.1 |
41.6 |
||||
Passo Gries |
64.4 |
22.4 |
34.7 |
64.4 |
34.8 |
54.0 |
64.4 |
31.3 |
48.6 |
||||
Cavarzere (LNG) |
26.4 |
24.4 |
92.5 |
26.4 |
24.4 |
92.4 |
26.4 |
24.9 |
94.3 |
||||
Gela (*) |
23.8 |
22.0 |
92.4 |
20.3 |
20.1 |
99.0 |
22.9 |
19.0 |
83.0 |
||||
Livorno (LNG) |
15.0 |
15.0 |
100.0 |
15.0 |
15.0 |
100.0 |
15.0 |
14.3 |
95.3 |
||||
Panigaglia (LNG) |
13.0 |
2.0 |
15.5 |
13.0 |
4.0 |
30.8 |
13.0 |
7.4 |
56.9 |
||||
Gorizia |
4.6 |
0.1 |
|
4.2 |
0.1 |
2.4 |
4.0 |
0.1 |
2.5 |
||||
Competing capacity (*) |
21.2 |
|
|
24.4 |
|
|
19.9 |
|
|
||||
|
364.2 |
258.8 |
71.0 |
360.8 |
287.0 |
79.5 |
362.9 |
231.4 |
63.8 |
||||
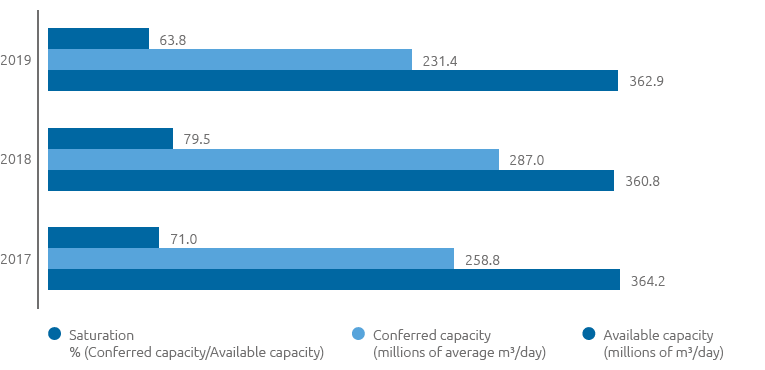
The transportation capacity of the network again covered all user demand in 2019. Average transportation capacity provided in 2019 at the entry points connected with foreign pipes and at regasification facilities was 362.9 million cubic metres on average per day, 19.9 of which were offered as competing capacities between the Mazara del Vallo and Gela entry points. In addition to the aforementioned capacities which concern the entry points interconnected with foreign countries and the LNG terminals, a transportation capacity is available at the domestic production entry points:
- national production at a total of 20.7 million cubic metres/day;
- the production of biomethane at a total of 0.3 million cubic metres/day.
Snam Rete Gas has prepared a long-term plan for available transportation capacity, which was sent to the Ministry of Economic Development on 28 June 2019 and published on the Snam website at www.snam.it/it/trasporto in the online services/capacity section.
The document shows data about capacity at all entry points interconnected with foreign countries and with LNG terminals for the thermal year 2019-2020 and subsequent years up to 30 September 2034.
Also shown for the thermal year 2019-2020 are the transport capacities of the interconnected exit points with the foreign countries of Passo Gries, Gorizia, Bizzarone and San Marino at a total of 46 million cubic metres/day. As a result of all the infrastructures of the “Supporting the north-west market and two-way cross-border flows” project coming into service, a total capacity of 40 million cubic metres/day became available simultaneously at the Passo Gries and Tarvisio exit points. The maximum capacity of the Passo Gries exit point is 40 million cubic metres/day, while the maximum capacity of the Tarvisio exit point is 18 million cubic metres/day, therefore there is a “competing capacity” pursuant to chapter 5, paragraph 3 of the Network Code available at the two points.
Over the last 16 years transport operators have been constantly increasing, going from around 30 operators in 2003 to around 210 operators in 2019 (including shippers and traders), with the number of customers (shippers) standing at 150 (136 in 2018).
In 2019 there was an increase in the number of Traders at PSV (Virtual Trading Points), which went from 52 Traders operating at the end of the 2017-2018 thermal year to 69 Traders operating at the end of the 2018 – 2019 thermal year.
In 2019, 123 connection agreements were entered into for the creation of new delivery/redelivery points or for upgrading existing ones, including 26 contracts for the injection of biomethane and 61 relating to CNG service areas.
Transportation capacity and saturation
| Download XLS (20 kB) |
|
2017 |
2018 |
2019 |
|---|---|---|---|
Active customers (shippers) |
128 |
136 |
150 |
New connection agreements for delivery/redelivery points |
78 |
88 |
123 |
Thanks to the development of Snam services over the last 15 years, the Italian gas market has seen constant growth in transportation operators, passing from 30 in 2003 to around 210 in 2019, with 150 shippers.
In 2019, 123 connection contracts were signed for the construction of new delivery/redelivery points (of which 26 were for biomethane injection and 61 for the CNG Service areas) or the upgrading of existing points.
In 2019, the integration process through which the commercial management activities of the 3 businesses - transportation, storage and regasification - merged into a single organisation continued, allowing the optimisation of the processes within Snam. The creation of a single commercial control room for the management of daily gas deliveries and movements, the balancing of the network (activities that define Snam’s responsibilities to the market), integrating the know-how of the 3 businesses managed by Snam, has led to an improvement in performance in this area.
From the point of view of services, on 22 May 2019 Snam opened the new Jarvis commercial platform of integrated services to its customers, implemented in 2018 and developed in conjunction with market operators. The platform, which actively involves customers, is designed to adopt a process for the renewal of services and technologies to support all commercial transportation, storage and regasification processes based on the feedback received from customers and also proposes to promote the range of integrated services offered on the Italian market possibly also enabling services for the foreign market. The platform provides customers with the possibility of:
- viewing its active contracts and having access to the documentation;
- accessing the transactions, in detail, for calculating the balancing credit limit;
- independently managing their user profiles.
To facilitate the transition to the new platform, from July 2019, Snam made a simulator of the new functionalities featured available to the market operators.
In September 2019, with the release of the Trading PSV system for gas trading activities, the new Jarvis platform came into force, at the same time as the progressive shutting down of the functionalities in the PSV system used previously.
Network codes list a number of indicators for monitoring the quality of service offered by the companies. When compared against these indicators, the Snam companies maintained a high level of performance in 2019 as well. One part of these indicators, which refer to specific levels of commercial quality, gives rise to the automatic indemnification of customers in the event of failure to comply with the service quality standard.
| Download XLS (20 kB) |
(%) |
2017 |
2018 |
2019 |
|---|---|---|---|
Contracted transport capacity/Available transport capacity (foreign entry/interconnection points) |
71 |
79 |
64 |
Compliance with deadlines for issuing offers for connection |
100 |
100 |
100 |
Compliance with time frames for providing services subject to specific commercial quality standards |
100 |
100 |
100 |
Organisational changes
During the course of 2019, the recorded number of personnel in servic 018 to 1,945 resources at 31 December 2019.
The organisational structure of group companies operating in the transportation and dispatching business was redesigned with a view to greater consistency with the Snam guidelines of streamlining the organisation and processes, aimed specifically at reducing duplications with Snam units dedicated to commercial and technical activities, and integration of transportation and storage activities.
Specifically, with reference to the transportation sector, note:
- the redesigning of the structure of the plant area with a view to increasing integration between transportation and storage activities, strengthening of the oversight of the area (creation of a Northern Facilities Area and Central-Southern Facilities Area) and a more comprehensive structuring of the centralised support service, in close conjunction with the Snam Technologies & Industrial Innovation unit BUAIT (creation of the Facilities Support unit and the BUAIT Technical Facilities unit);
- the redefinition of part of the organisation dedicated to Engineering and Construction activities with the definition of structures dedicated to the creation of Facilities and the establishment of integrated oversight support dedicated to engineering and authorisation activities;
- the move to Snam Rete Gas of all commercial activities, previously monitored by Snam, with a view to the full integration of all activities in the regulated sector and simplification of the organisational model, with the creation, at the same time, of a Commercial and Dispatching unit, in which all physical dispatching and gas measurement activities have been incorporated, previously the responsibility of the gas operations unit.
In relation to the opportunity to pursue economies of experience and scope that develop Group best practices, and to the specific requirements of other operating companies, several Snam Rete Gas structures provide technical services (for example, with regard to engineering and project management activities aimed at large investments). In addition, in relation to the organisational changes listed above, Snam Rete Gas also guarantees the supply to Stogit and LNG Italia of the commercial services previously delivery by Snam.
Accidents
In 2019 the number of accidents was 0 for employees and 5 for contractors (compared with 4 and 3 in 2018).
| Download XLS (20 kB) |
|
2017 |
2018 |
2019 |
|---|---|---|---|
Total employee accidents |
2 |
4 |
0 |
Total contract worker accidents |
4 |
3 |
5 |
| Download XLS (21 kB) |
|
2017 |
2018 |
2019 |
||||
|---|---|---|---|---|---|---|---|
|
|||||||
Employees |
|
|
|
||||
Frequency index (*) |
0.66 |
1.29 |
0 |
||||
Severity index (**) |
0.03 |
0.03 |
0 |
||||
Contract workers |
|
|
|
||||
Frequency index (*) |
0.47 |
0.46 |
0.83 |
||||
Severity index (**) |
0.90 |
0.03 |
0.08 |
||||
Energy consumption and emissions
The company, in accordance with its sustainable growth model, updated and set new voluntary targets, valid objectives for all Snam businesses (transportation, storage, regasification):
- to reduce its natural gas emissions by 2022 and 2025, respectively by 15% an 40%, excluding emergencies, compared with the 2016 figures;
- to reduce its scope 1 and scope 2 emissions by 2030 by 40%, excluding emergencies, compared with the 2016 figures;
- to increase the ratio between green electricity bought and the total to reach 55% by 2030.
In 2019 the emission into the atmosphere of 9.4 million cubic metres of natural gas was prevented, equal to around 165,000 tonnes of CO2eq (16% compared with 142,000 tonnes of CO2eq in 2018). These performances were made possible by the on-line gas compression interventions and the interventions with tapping machines, technology that makes it possible to disconnect pipelines in operation for new connections without an interruption to the service. These results led to a reduction in natural gas emissions of 11.7% compared with 2018, a trend completely in line with the general targets.
Total emissions of CO2eq avoided in 2019 resulting from the various initiatives adopted by the company (missing natural gas emissions, production of electricity from photovoltaic plants, purchase of green electricity, installation of LED bulbs to replace other tradition bulbs, smart working) have globally made it possible to prevent the emission into the atmosphere of 181,800 tonnes of CO2eq.
Energy consumption for transport, equal to 6,123 Terajoule (TJ), decreased by around 18% compared with 2018 in spite of an overall increase in gas injected into the network (+3.5%). This result was promoted by the difference provenance of the gas from import points (less use of the back-up network from North Africa more energy-intensive than the other ones).
In 2019, nitrogen oxide emissions totalled around 286 tonnes (-6.2% compared with 2018). To contain emissions, a programme that calls for modifying certain turbines already in operation and the installation of new units with low emission combustion systems (Dry Low Emissions) has been in progress for years. In 2019 the percentage of DLE turbines operating in transportation stood at around 95%.
| Download XLS (21 kB) |
|
2017 |
2018 |
2019 |
||
|---|---|---|---|---|---|
|
|||||
Energy consumption (TJ) |
7,459 |
7,463 |
6,123 |
||
Emissions of CO2eq - scope1 (ton) (*) |
1,008,051 |
981,866 |
838,326 |
||
Emissions of natural gas (106 m3) |
34.4 |
32.8 |
28.7 |
||
Natural gas recovered (106 m3) |
4.1 |
8.2 |
9.4 |
||
NOx emissions (tonnes) |
342 |
305 |
286 |
||