Results
In order to allow a better evaluation of the economic-financial performance, this Report presents the reclassified financial statements and several alternative performance indicators (Non-GAAP measures), mainly represented by the results in an adjusted configuration5. Specifically, adjusted EBIT and net profit are obtained by excluding the special items (respectively gross and net of the related taxes) from the operating profit and the reported net profit, as per the legal scheme of the Income Statement.
Income entries classified as special items for 2019 refer to: (i) financial expense from the buy back on the market of bonds under the scope of the liability management operation (€29 million excluding the tax effect); (ii) the effects of the release to the income statement of the provision for impairment losses (€26 million excluding the tax effect) following the announcement by the Council of State of 5 March 2020 with regard to uncollected receivables relating to balancing activities.
Adjusted results5
Adjusted EBIT (€ Mn)
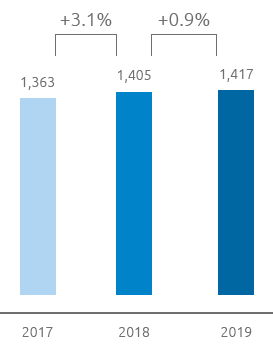
Thanks to the solidity and efficiency of the operational management and strict financial discipline, Snam achieved positive results in line with expectations in 2019. Adjusted EBIT6 totalled €1,417 million, up by €12 million (0.9%) compared with the adjusted EBIT for 2018. The greater revenue (+€76 million or 3.0%), essentially attributable to the natural gas transportation segment business, which benefits from the increase in tariff parameters and the investments of past years, and the contribution for the whole of 2019 of the businesses that joined the scope of consolidation in 2018 were partly offset by the increase in depreciation and amortisation (-€40 million, or 5.9%) and write-downs (-€22 million) referred to works in progress of past years’ projects. Operating costs were essentially in line compared with the adjusted figure for 2018 (-€2 million or 0.5%). The effects of the actions of the efficiency plan implemented, around €15 million, were absorbed by the costs, for the year 2019, of the businesses that entered the scope of consolidation in 2018 and the new business initiatives and by the costs related to the continuation of activities in the energy transition.
Adjusted net EBIT (€ Mn)
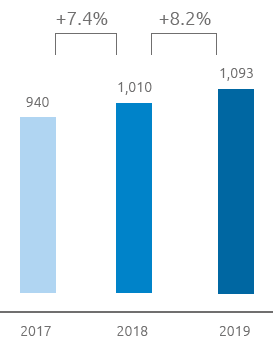
Adjusted net EBIT totalled €1,093 million, up by €83 million (8.2%) compared with adjusted net EBIT for 2018. The increase, in addition to the greater EBIT (€12 million or +0.9%) is due to the lower net financial expense (+€30 million or 15.4%) thanks to the benefits of the actions for optimising the financial structure implemented, as well as the positive market conditions, as well as greater net income from equity investments (€57 million or +35.8%) mainly courtesy of contribution of Senfluga, after the acquisition timing of DESFA (December 2018) and an exceptionality of performances recorded in 2019, and Terēga. These effects were partly absorbed by higher income taxes (-€16 million;4.5%), due mainly to the greater pre-tax profit.
Free cash flow
+ €482
million
Net financial debt was €11,923 million at 31 December 2019, compared with € 11,548 million at 31 December 2018. The net cash flow from operations (€1,486 million) allowed us to fully cover the financial requirements associated with net investments (€1,004 million) and to generate a free cash flow of €482 million. The net financial debt, after cash flows from self-owned capital deriving from the payment to shareholders of the 2018 dividend (€746 million, of which an interim dividend of €298 million and €448 million for the balance) and the acquisition of treasury shares (€39 million), recorded an increase of €375 million compared with 31 December 2018, including non-monetary components related to financial debt (€75 million), which refer mainly to the change in the scope of consolidation and the financial debt recorded through the application of IFRS 16 “Leasing”.
Dividends
Dividend
€0.2376
per share
Our healthy results and solid business fundamentals allow us to propose a dividend of €0.2376 per share, to the Shareholders’ Meeting, of which €0.095 per share was paid in January 2020 as an interim dividend (€313 million) and the balance of €0.1426 per share will be paid from 24 June 2020 with an ex-dividend date of 22 June 2020 (record date 23 June 2020). The proposed dividend, up 5% compared with 2018, in line with the dividend policy announced in the strategic plan, confirms Snam’s commitment to guaranteeing shareholders an attractive remuneration that is sustainable over a period of time.
| Download XLS (22 kB) |
(millions of €) |
2017 |
2018 |
2019 |
Change |
% change |
||||||
|---|---|---|---|---|---|---|---|---|---|---|---|
|
|||||||||||
Total revenue |
2,533 |
2,586 |
2,665 |
79 |
3.1 |
||||||
Total revenues net of pass-through items |
2,441 |
2,528 |
2,604 |
76 |
3.0 |
||||||
Operating costs (b) |
511 |
491 |
496 |
5 |
1.0 |
||||||
Operating costs net of pass-through items (b) |
419 |
433 |
435 |
2 |
0.5 |
||||||
EBITDA (b) |
2,022 |
2,095 |
2,169 |
74 |
3.5 |
||||||
EBIT (b) |
1,363 |
1,405 |
1,417 |
12 |
0.9 |
||||||
Net profit (b) (c) |
940 |
1,010 |
1,093 |
83 |
8.2 |
||||||
| Download XLS (21 kB) |
(millions of €) |
2017 |
2018 |
2019 |
Change |
% change |
||
|---|---|---|---|---|---|---|---|
|
|||||||
EBIT |
1,348 |
1,384 |
1,452 |
68 |
4.9 |
||
Net profit (a) |
897 |
960 |
1,090 |
130 |
13.5 |
||
| Download XLS (23 kB) |
|
|
2017 |
2018 |
2019 |
Change |
% change |
||||||||||||||
|---|---|---|---|---|---|---|---|---|---|---|---|---|---|---|---|---|---|---|---|---|
|
||||||||||||||||||||
Net profit per share (a) |
(€) |
0.262 |
0.286 |
0.330 |
0.044 |
15.5 |
||||||||||||||
Adjusted net profit per share (a) |
(€) |
0.275 |
0.301 |
0.331 |
0.030 |
10.1 |
||||||||||||||
Group shareholders’ equity per share (a) |
(€) |
1.81 |
1.78 |
1.90 |
0.12 |
6.5 |
||||||||||||||
Pay-out (Dividend for the period/Group net profit) (b) |
% |
81.61 |
77.71 |
71.56 |
(6.15) |
(7.9) |
||||||||||||||
Dividend yield (Dividend for the period/year-end official share price) (b) |
% |
5.3 |
5.9 |
5.1 |
(0.8) |
(13.9) |
||||||||||||||
Price/Book value (Average official price per share/Group shareholders’ equity per share) |
(€) |
2.24 |
2.10 |
2.36 |
0.26 |
12.4 |
||||||||||||||
| Download XLS (22 kB) |
(millions of €) |
2017 |
2018 |
2019 |
Change |
% change |
|---|---|---|---|---|---|
Technical investments |
1,034 |
882 |
963 |
81 |
9.2 |
Net invested capital at 31 December |
17,738 |
17,533 |
18,181 |
648 |
3.7 |
Group Shareholders’ equity at 31 December |
6,188 |
5,985 |
6,255 |
270 |
4.5 |
Net financial debt at 31 December |
11,550 |
11,548 |
11,923 |
375 |
3.2 |
Free cash flow |
423 |
1,161 |
482 |
(679) |
(58.5) |
| Download XLS (23 kB) |
|
|
2017 |
2018 |
2019 |
Change |
% change |
||
|---|---|---|---|---|---|---|---|---|
|
||||||||
Number of shares of share capital |
(million) |
3,501 |
3,469 |
3,395 |
(74) |
(2.1) |
||
Number of shares outstanding on 31 December |
(million) |
3,415 |
3,301 |
3,292 |
(9) |
(0.3) |
||
Average number of shares outstanding during the year |
(million) |
3,422 |
3,358 |
3,301 |
(57) |
(1.7) |
||
Year-end official share price |
(€) |
4.086 |
3.820 |
4.686 |
0.866 |
22.7 |
||
Average official share price during the period |
(€) |
4.043 |
3.747 |
4.474 |
0.727 |
19.4 |
||
Stock Exchange capitalisation |
(million) |
13,953 |
12,606 |
15,428 |
2,822 |
22.4 |
||
Dividend per share |
(€ per share) |
0.2155 |
0.2263 |
0.2376 |
(0.0113) |
5.0 |
||
Dividends for the period (*) |
(million) |
731 |
746 |
780 |
(34) |
4.6 |
||
Dividends paid in the period |
(million) |
718 |
731 |
746 |
15 |
2.1 |
||
5 For the definition of these indicators and the reconciliation with the related reported results, in line with the guidelines of the 2015/ESMA1415 document “ESMA Guidelines on Alternative Performance Measures” of 5 October 2015, please refer to the chapter “Financial review and other information - Non-GAAP measures ”.
6 EBIT was analysed by isolating only the elements that resulted in a change to that figure. To this end, applying gas sector tariff regulations generates revenue components that are offset in costs, due mainly to interconnection.