Operating review
Gas balance on the National Transportation Network
Gas volumes are expressed in standard cubic metres (SCM) with a traditional higher heating value (HHV) of 38.1 MJ/SCM (10,572 kWh/SCM). The basic figure is measured in energy (MJ) and obtained by multiplying the physical cubic metres actually measured by the relative heating value.
| Download XLS (22 kB) |
(billions of m3) |
2017 |
2018 (a) |
2019 |
Change |
% change (b) |
||||||||
|---|---|---|---|---|---|---|---|---|---|---|---|---|---|
|
|||||||||||||
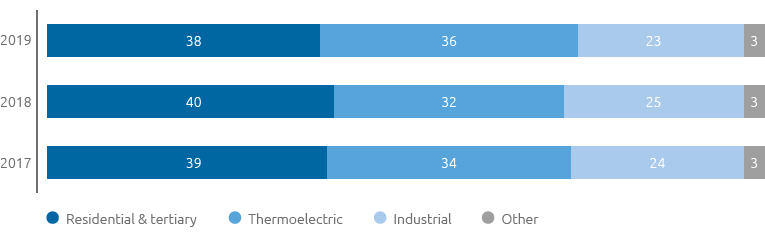
Residential and tertiary |
29.48 |
28.76 |
28.15 |
(0.61) |
(2.1) |
||||||||
Thermoelectric |
25.36 |
24.19 |
26.64 |
2.45 |
10.1 |
||||||||
Industrial (c) |
17.8 |
17.39 |
17.14 |
(0.25) |
(1.4) |
||||||||
Other (d) |
2.51 |
2.33 |
2.41 |
0.08 |
3.4 |
||||||||
Total |
75.15 |
72.67 |
74.34 |
1.67 |
2.3 |
||||||||
Gas demand in Italy in 2019 was 74.34 billion cubic metres, up 1.67 billion cubic metres (2.3%) compared with 2018. The increase is mainly attributable to the higher consumption in the thermoelectric power generation sector (+2.45 billion cubic metres; +10.1%) and benefited from the greater use of natural gas in the generation of electricity, the reduction in electricity imports and the smaller production from renewable sources as hydroelectric power generation has decreased, despite the growth in wind and solar power. Greater recourse to natural gas in the generation of electricity is also attributable, as well as to the greater competitiveness of the price of natural gas at the virtual exchange point, down by around 37% compared with 2018, to an increase in the costs of the emission of CO2 (+50% compared with 2018) that penalises generation from coal.
The increase in consumption recorded in the thermoelectric sector was partly offset by lower consumption in the residential and tertiary sector (-0.61 billion cubic metres or -2.1%) attributable to the weather and, to a lesser extent, the industrial sector (-0.25 billion cubic metres or -1.4%).
Gas demand by sector (% of total gas demand)
Gas demand (Bcm)
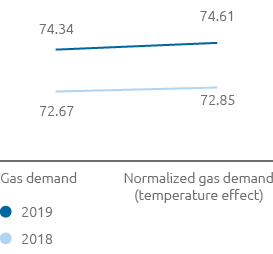
Adjusted for the weather effect, gas demand came to 74.61 billion cubic metres, up 1.76 billion cubic metres (+2.4%) compared with the same figure in 2018 (72.85 billion cubic metres), also following the greater use of energy efficiency enhancing measures by the residential and tertiary sector.
| Download XLS (22 kB) |
(billions of m3) |
2017 |
2018 (*) |
2019 |
Change |
% change (b) |
||||
|---|---|---|---|---|---|---|---|---|---|
|
|||||||||
From gas injected into the network by entry point |
69.35 |
67.70 |
70.86 |
3.16 |
4.7 |
||||
From domestic output |
5.24 |
5.12 |
4.51 |
(0.61) |
(11.9) |
||||
Total gas injected into the network |
74.59 |
72.82 |
75.37 |
2.55 |
3.5 |
||||
Net balance of withdrawal/injection into storage (**) |
0.23 |
(0.43) |
(1.39) |
(0.96) |
|
||||
Total availability of natural gas |
74.82 |
72.39 |
73.98 |
1.59 |
2.2 |
||||
The availability of natural gas in Italy (73.98 billion cubic metres) is equal to the sum of gas injected into the National Transportation Network and the net balance of withdrawals from and injections into the storage system, and was up by 1.59 billion cubic metres (+2.2%) compared with 2018. The increase is due to greater volumes of gas injected into the network per point of entry (+3.16 billion cubic metres or +4.7%), in spite of the reduction in domestic production (-0.61 billion cubic metres or -11.9%), partly offset by the greater net injections into storage compared with the previous year (-0.96 billion cubic metres).
| Download XLS (22 kB) |
(billions of m3) |
2017 |
2018 |
2019 |
Change |
% change |
||||
|---|---|---|---|---|---|---|---|---|---|
|
|||||||||
Domestic output |
5.24 |
5.12 |
4.51 |
(0.61) |
(11.9) |
||||
Entry points (**) |
69.35 |
67.70 |
70.86 |
3.16 |
4.7 |
||||
Tarvisio |
30.18 |
29.69 |
29.85 |
0.16 |
0.5 |
||||
Gries Pass |
7.25 |
7.76 |
11.13 |
3.37 |
43.4 |
||||
Mazara del Vallo |
18.88 |
17.09 |
10.21 |
(6.88) |
(40.3) |
||||
Cavarzere (LNG) |
6.85 |
6.71 |
7.91 |
1.20 |
17.9 |
||||
Gela |
4.64 |
4.47 |
5.70 |
1.23 |
27.5 |
||||
Livorno (LNG) |
0.91 |
1.07 |
3.62 |
2.55 |
|
||||
Panigaglia (LNG) |
0.62 |
0.88 |
2.42 |
1.54 |
|
||||
Gorizia |
0.02 |
0.03 |
0.02 |
(0.01) |
(33.3) |
||||
|
74.59 |
72.82 |
75.37 |
2.55 |
3.5 |
||||