Sustainability
Methane emissions/network km
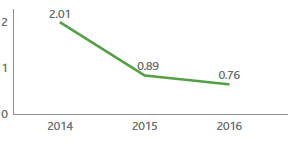
NOx emissions/energy used
Safety at work – Accidents at work – Frequency rate for employees and contractors
| Download XLS (23 kB) |
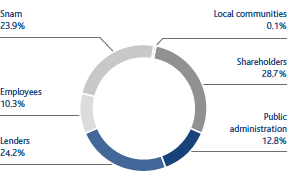
(€ millions) |
2014 |
2015 |
2016 |
Value-added produced (A) |
2,445 |
2,429 |
2,518 |
Value-added distributed (B) |
1,907 |
1,831 |
1,917 |
Employees |
241 |
238 |
260 |
Local communities |
3 |
2 |
2 |
Donations and sponsorship |
1 |
1 |
1 |
Legal compensation for environmental damage |
2 |
1 |
1 |
Lenders (Bond holders and Banks) |
377 |
347 |
610 |
Shareholders |
875 |
875 |
722 |
Public administration |
411 |
369 |
323 |
Direct taxation |
394 |
357 |
308 |
Indirect taxation |
17 |
12 |
15 |
Value-added retained by the Company (A) - (B) |
538 |
598 |
601 |