Gas distribution on the national transportation network
Gas volumes are expressed in standard cubic metres (SCM) with a traditional higher heating value (HHV) of 38.1 MJ/SCM. The basic figure is measured in energy (MJ) and obtained by multiplying the physical cubic metres actually measured by the relative heating value.
| Download XLS (23 kB) |
|
Availability of natural gas |
|||||||
|
|
|
|
|
|
|
||
|
(billion m3) |
2011 |
2012 |
2013 |
Change |
% Change |
||
|
|||||||
|
From imports |
70.27 |
67.61 |
61.53 |
(6.08) |
(9.0) |
||
|
Domestic output |
8.03 |
8.17 |
7.48 |
(0.69) |
(8.4) |
||
|
Total gas injected into the network |
78.30 |
75.78 |
69.01 |
(6.77) |
(8.9) |
||
|
Net balance of withdrawals from/injections into storage (*) |
(0.89) |
(1.51) |
0.49 |
2.00 |
|
||
|
Total availability of natural gas |
77.41 |
74.27 |
69.50 |
(4.77) |
(6.4) |
||
The availability of natural gas in Italy in 2013 was 69.50 billion cubic metres, down 4.77 billion cubic metres (-6.4%) compared with 2012.
The quantities of gas issued by the national transportation network decreased by 8.9%, to 69.01 billion cubic metres (75.78 billion cubic metres in 2012), due to reduced imports (-6.08 billion cubic metres; -9.0%) and national production (-0.69 billion cubic metres; -8.4%), partly offset by greater net withdrawals from storage (+2.00 billion cubic metres).
The analysis of imports by entry point is as follows:
| Download XLS (23 kB) |
|
Imports by entry point |
|||||
|
|
|
|
|
|
|
|
(billion m3) |
2011 |
2012 |
2013 |
Change |
% Change |
|
Entry points |
|
|
|
|
|
|
Tarvisio |
26.45 |
23.85 |
30.26 |
6.41 |
26.9 |
|
Mazara del Vallo |
21.55 |
20.82 |
12.46 |
(8.36) |
(40.2) |
|
Gries Pass |
10.86 |
9.03 |
7.49 |
(1.54) |
(17.1) |
|
Gela |
2.34 |
6.47 |
5.70 |
(0.77) |
(11.9) |
|
Cavarzere (LNG) |
7.02 |
6.17 |
5.35 |
(0.82) |
(13.3) |
|
Livorno (LNG) |
|
|
0.21 |
0.21 |
|
|
Panigaglia (LNG) |
1.89 |
1.12 |
0.05 |
(1.07) |
(95.5) |
|
Gorizia |
0.16 |
0.15 |
0.01 |
(0.14) |
(93.3) |
|
|
70.27 |
67.61 |
61.53 |
(6.08) |
(9.0) |
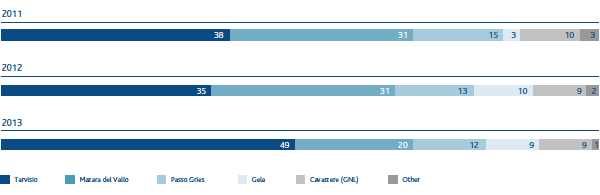
Imports were down by -6.08 billion cubic metres, due mainly to lower volumes injected at the Mazara del Vallo (-8.36 billion cubic metres; -40.2%), Gries Pass (-1.54 billion cubic metres; -17.1%) and Gela (-0.77 billion cubic metres; -11.9%) entry points and to lower volumes injected by the Panigaglia and Cavarzere regasification terminals (-1.07 billion cubic metres and -0.82 billion cubic metres respectively). These factors were partly offset by higher imports from Russia at the Tarvisio entry point (+6.41 billion cubic metres; +26.9%) and by the opening in October of the new Livorno regasification terminal, which injected 0.21 billion cubic metres into the network.
NATURAL GAS INJECTED INTO THE NETWORK BY ENTRY POINT (% OF TOTAL GAS INJECTED)
| Download XLS (22 kB) |
|
Volumes of natural gas injected into the network by user |
|||||
|
|
|
|
|
|
|
|
(billion m3) |
2011 |
2012 |
2013 |
Change |
% Change |
|
Eni |
35.12 |
36.29 |
37.56 |
1.27 |
3.5 |
|
Enel Trade |
9.34 |
8.43 |
6.99 |
(1.44) |
(17.1) |
|
Other |
33.84 |
31.06 |
24.46 |
(6.60) |
(21.2) |
|
|
78.30 |
75.78 |
69.01 |
(6.77) |
(8.9) |