Key figures
To improve the economic and financial review, in addition to conventional IAS/IFRS indicators and financial statements, the Directors’ Report also contains reclassified financial statements and several alternative performance indicators such as EBITDA, EBIT, adjusted EBIT, adjusted net profit and net financial debt. The tables below, their explanatory notes and the reclassified financial statements describe how these amounts were determined. Unless otherwise specified, definitions of the terms used can be found in the glossary.
| Download XLS (23 kB) |
|
Key financial figures |
|||||||
|
|
|
|
|
||||
|
(€ million) |
2011 |
2012 |
2013 |
||||
|
|||||||
|
3,539 |
3,730 |
3,735 |
|||||
|
Core business revenue net of the effects of IFRIC 12 |
3,179 |
3,405 |
3,416 |
||||
|
993 |
1,129 |
1,045 |
|||||
|
Operating costs net of the effects of IFRIC 12 |
633 |
804 |
726 |
||||
|
EBITDA |
2,612 |
2,817 |
2,803 |
||||
|
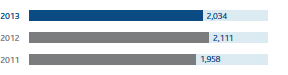
1,958 |
2,111 |
2,034 |
|||||
|
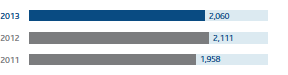
Adjusted EBIT (a) |
1,958 |
2,111 |
2,060 |
||||
|
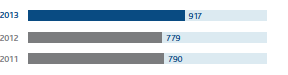
Net profit (b) |
790 |
779 |
917 |
||||
|
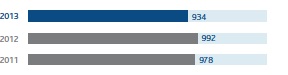
Adjusted net profit (a) (b) |
978 |
992 |
934 |
||||
| Download XLS (23 kB) |
|
Key balance sheet and cash flow figures |
|||||
|
|
|
|
|
||
|
(€ million) |
2011 |
2012 |
2013 |
||
|
|||||
|
Technical investments |
1,585 |
1,300 |
1,290 |
||
|
Net invested capital at 31 December (*) |
16,989 |
18,314 |
19,320 |
||
|
Shareholders’ equity including minority interests at 31 December (*) |
5,792 |
5,916 |
5,994 |
||
|
Group shareholders’ equity at 31 December (*) |
5,791 |
5,915 |
5,993 |
||
|
Net financial debt at 31 December |
11,197 |
12,398 |
13,326 |
||
|
Free cash flow |
(52) |
(390) |
(92) |
||
| Download XLS (23 kB) |
|
Key share figures |
||||||||
|
|
|
|
|
|
||||
|
(€ million) |
|
2011 |
2012 |
2013 |
||||
|
||||||||
|
Number of shares of share capital |
(millions) |
3,571.2 |
3,381.6 |
3,381.6 |
||||
|
Number of shares outstanding on 31 December |
(millions) |
3,378.6 |
3,378.7 |
3,380.0 |
||||
|
Average number of shares outstanding during the year |
(millions) |
3,378.0 |
3,378.7 |
3,379.5 |
||||
|
Year-end official share price |
(€) |
3.39 |
3.52 |
4.04 |
||||
|
Average official share price during the period |
(€) |
3.75 |
3.43 |
3.66 |
||||
|
Market capitalisation (a) |
|
11,454 |
11,893 |
13,655 |
||||
|
Dividend per share |
(€ per share) |
0.24 |
0.25 |
0.25 |
||||
|
Dividends per period (b) |
|
811 |
845 |
845 |
||||
|
Dividends paid in the period |
|
811 |
811 |
845 |
||||
| Download XLS (24 kB) |
|
Key profit and financial indicators |
||||||||||
|
|
|
|
|
|
||||||
|
|
|
2011 |
2012 |
2013 |
||||||
|
||||||||||
|
EBIT per share (a) |
(€) |
0.580 |
0.625 |
0.602 |
||||||
|
Adjusted EBIT per share (a) |
(€) |
0.580 |
0.625 |
0.610 |
||||||
|
Net profit per share (a) |
(€) |
0.234 |
0.231 |
0.271 |
||||||
|
Adjusted net profit per share (a) |
(€) |
0.290 |
0.294 |
0.276 |
||||||
|
Group shareholders’ equity per share (a) |
(€) |
1.71 |
1.75 |
1.77 |
||||||
|
Pay-out (Dividends per period/Net profit) |
% |
102.7 |
108.5 |
92.1 |
||||||
|
Adjusted pay-out (Dividends per period/Adjusted net profit) |
% |
82.9 |
85.2 |
90.5 |
||||||
|
ROE (b) |
% |
13.5 |
13.3 |
15.4 |
||||||
|
ROI (c) |
% |
11.8 |
12.0 |
10.8 |
||||||
|
Dividend yield (Dividend for the period/year-end official share price) |
% |
7.1 |
7.1 |
6.2 |
||||||
|
Price/Book value |
(€) |
2.19 |
1.95 |
2.06 |
||||||
| Download XLS (26 kB) |
|
Key operating figures (a) |
|||||||||||||||
|
|
|
|
|
|
|
||||||||||
|
|
2011 |
2012 |
2013 |
Change |
% Change |
||||||||||
|
|||||||||||||||
|
Natural gas transportation (b) |
|
|
|
|
|
||||||||||
|
Natural gas injected in the gas transportation network (billions of cubic metres) |
78.30 |
75.78 |
69.01 |
(6.77) |
(8.9) |
||||||||||
|
Transportation network (kilometres in use) |
32,010 |
32,245 |
32,306 |
61 |
0.2 |
||||||||||
|
Installed power in the compression stations (MW) |
884.6 |
864.1 |
866.9 |
2.8 |
0.3 |
||||||||||
|
Liquefied Natural Gas (LNG) regasification (b) |
|
|
|
|
|
||||||||||
|
LNG regasification (billions of cubic metres) |
1.89 |
1.12 |
0.05 |
(1.07) |
(95.5) |
||||||||||
|
Natural gas storage (b) |
|
|
|
|
|
||||||||||
|
Available storage capacity (billions of cubic metres) (c) |
10.0 |
11.2 |
11.4 |
0.20 |
1.8 |
||||||||||
|
Natural gas moved through the storage system (billions of cubic metres) |
15.31 |
15.63 |
18.42 |
2.79 |
17.9 |
||||||||||
|
Natural gas distribution |
|
|
|
|
|
||||||||||
|
Active meters (millions) |
5.897 |
5.907 |
5.928 |
0.021 |
0.4 |
||||||||||
|
Gas distribution concessions (number) |
1,449 |
1,435 |
1,435 |
|
|
||||||||||
|
Distribution network (kilometres) (d) |
52,516 |
52,586 |
52,993 |
407 |
0.8 |
||||||||||
|
Employees in service at year-end (number) (e) |
6,112 |
6,051 |
6,045 |
(6) |
(0.1) |
||||||||||
|
by business segment: |
|
|
|
|
|
||||||||||
|
- Transportation |
2,755 |
1,978 |
1,952 |
(26) |
(1.3) |
||||||||||
|
- Regasification |
74 |
78 |
79 |
1 |
1.3 |
||||||||||
|
- Storage |
278 |
307 |
303 |
(4) |
(1.3) |
||||||||||
|
- Distribution |
3,005 |
3,016 |
3,008 |
(8) |
(0.3) |
||||||||||
|
- Corporate |
|
672 |
703 |
31 |
4.6 |
||||||||||