Withdrawals of natural gas
| Download XLS (23 kB) |
|
Withdrawals of natural gas |
|||||||||
|
|
|
|
|
|
|
||||
|
(billions of m3) |
2011 |
2012 |
2013 |
Change |
% Change |
||||
|
|||||||||
|
Redelivery to the domestic market |
76.69 |
73.49 |
69.05 |
(4.44) |
(6.0) |
||||
|
Exports and transit (*) |
0.42 |
0.38 |
0.28 |
(0.10) |
(26.3) |
||||
|
Consumption and emissions attributable to Snam Rete Gas |
0.27 |
0.27 |
0.25 |
(0.02) |
(7.4) |
||||
|
Unaccounted-for gas (UFG) and other changes (**) |
0.03 |
0.13 |
(0.08) |
(0.21) |
|
||||
|
Total withdrawals of natural gas |
77.41 |
74.27 |
69.50 |
(4.77) |
(6.4) |
||||
The natural gas withdrawn from the national transportation network in 2013 (69.50 billion cubic metres) is mainly: (i) for redelivery to users at the network exit points (69.05 billion cubic metres); (ii) exports and transit (0.28 billion cubic metres), mainly to Slovenia; and (iii) consumption by the compression stations and the gas emissions from the network and from Snam Rete Gas plants (0.25 billion cubic metres).
| Download XLS (23 kB) |
|
Reconciliation of the gas withdrawn from the network and Italian demand |
|||||||||||
|
|
|
|
|
|
|
||||||
|
(billion m3) |
2011 |
2012 |
2013 |
Change |
% Change(*) |
||||||
|
|||||||||||
|
Quantities withdrawn |
77.41 |
74.27 |
69.50 |
(4.77) |
(6.4) |
||||||
|
Exports (-) (**) |
(0.42) |
(0.38) |
(0.28) |
0.10 |
(26.3) |
||||||
|
Gas injected into the regional networks of other operators |
0.06 |
0.05 |
0.05 |
|
|
||||||
|
Other consumption (***) |
0.87 |
0.97 |
0.80 |
(0.17) |
(17.5) |
||||||
|
Total Italian demand |
77.92 |
74.91 |
70.07 |
(4.84) |
(6.5) |
||||||
| Download XLS (23 kB) |
|
Demand for gas in Italy |
|||||||||||||
|
|
|
|
|
|
|
||||||||
|
(billion m3) |
2011 |
2012(*) |
2013 |
Change |
% Change(**) |
||||||||
|
|||||||||||||
|
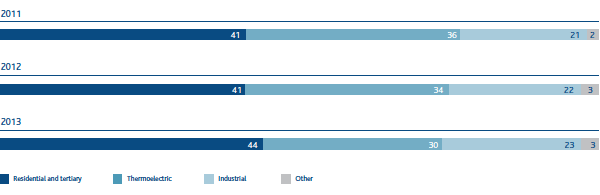
Residential and tertiary |
30.82 |
31.00 |
30.77 |
(0.23) |
(0.7) |
||||||||
|
Thermoelectric |
28.21 |
25.29 |
21.16 |
(4.13) |
(16.3) |
||||||||
|
Industrial (***) |
17.04 |
16.64 |
16.27 |
(0.37) |
(2.2) |
||||||||
|
Other (****) |
1.85 |
1.98 |
1.87 |
(0.11) |
(5.5) |
||||||||
|
|
77.92 |
74.91 |
70.07 |
(4.84) |
(6.5) |
||||||||
Gas demand in Italy was 70.07 billion cubic metres in 2013, down by 4.84 billion cubic metres (-6.5%) compared with 2012. This decrease, which occurred in all sectors, mainly reflected lower consumption in the thermoelectric sector (-16.3%), due to a contraction in electricity demand and simultaneous growth in the production of energy from renewable sources (mainly hydroelectric, wind and photovoltaic power), in the industrial sector (-2.2%), due to a downturn in output, and in the residential and tertiary sector (-0.7%), due to weather trends.
Adjusted for weather effect, gas demand was 70.43 billion cubic metres, down 3.91 billion cubic metres (-5.2%) compared with 2012 (74.34 billion cubic metres).
GAS DEMAND BY SECTOR (% OF TOTAL GAS DEMAND)
| Download XLS (23 kB) |
|
|
|
|
|
|
|
|
|
|
|
|
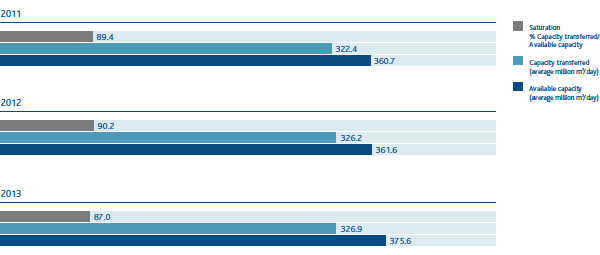
(million of m3 /average per day) |
Calendar year 2011 |
Calendar year 2012 |
Calendar year 2013 |
||||||
|
Transportation capacity |
Allocated capacity |
Saturation |
Transportation capacity |
Allocated capacity |
Saturation |
Transportation capacity |
Allocated capacity |
Saturation |
|
|
Tarvisio |
115.0 |
111.4 |
96.9 |
114.4 |
109.7 |
95.9 |
113.6 |
105.8 |
93.2 |
|
Mazara del Vallo |
103.0 |
92.1 |
89.4 |
103.0 |
87.8 |
85.2 |
102.9 |
86.7 |
84.3 |
|
Gries Pass |
64.7 |
58.1 |
89.8 |
64.4 |
61.8 |
96.0 |
64.4 |
57.4 |
89.1 |
|
Gela |
33.8 |
27.4 |
81.1 |
35.6 |
31.2 |
87.6 |
35.5 |
29.9 |
84.2 |
|
Cavarzere (LNG) |
26.4 |
24.7 |
93.6 |
26.4 |
23.9 |
90.5 |
26.4 |
21.0 |
79.5 |
|
Livorno (LNG) |
|
|
|
|
|
|
15.0 |
15.0 |
100.0 |
|
Panigaglia (LNG) |
13.0 |
8.3 |
63.8 |
13.0 |
11.3 |
86.9 |
13.0 |
11.0 |
84.6 |
|
Gorizia |
4.8 |
0.4 |
8.3 |
4.8 |
0.5 |
10.4 |
4.8 |
0.1 |
2.1 |
|
|
360.7 |
322.4 |
89.4 |
361.6 |
326.2 |
90.2 |
375.6 |
326.9 |
87.0 |
The transportation capacity of the network again covered all user demand in 2013. Average transportation capacity provided in 2013 was 375.6 million cubic metres on average per day. In addition to the aforementioned capacities which concern the entry points interconnected with foreign countries and the LNG terminals, a transportation capacity totalling 33 million cubic metres on average per day is available at the domestic production entry points.
With regard to overall allocated capacity in calendar year 2013, commercial supply at the connection points with European countries increased from 1 April 2013, due to the sale of daily capacity products. These have made the Italian gas system more flexible, and also accessible to operators with short-term or spot gas supply contracts.
Snam Rete Gas has produced its long-term plan for transportation capacity, which was submitted to the Ministry of Economic Development on 24 June 2013 and published in the Business and Services section of the Snam Rete Gas website (www.snamretegas.it).
Lastly, ISO 9001 certification has been confirmed for the transportation capacity definition process.