Section II – Compensation and other information
Implementation of 2014 Remuneration Policies
A description of the remuneration measures implemented in 2014 for the Chairman of the Board of Directors, non-executive directors, the Chief Executive Officer and managers with strategic responsibilities is set out below.
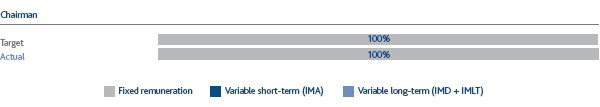
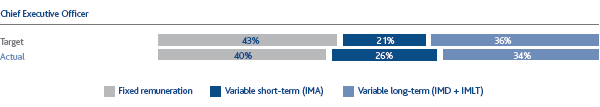
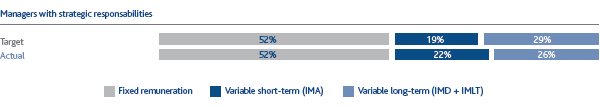
Implementation of the 2014 Remuneration Policy, as approved by the Remuneration Committee during the periodic assessment required by the Code of Corporate Governance, remained in line with the general principles referred to in the resolutions passed by the Board of Directors. On the basis of the Committee’s assessment, the 2014 Policy was essentially in line with the market benchmarks identified, in terms of both overall positioning and pay mix. The graph in Figure 9 below compares (for the Chairman, Chief Executive Officer and managers with strategic responsibilities) the pay mix of any amount paid in 2014 (Actual) with the pay mix projected for targeted results (Target) as indicated in the first section of the 2014 Remuneration Report.
Although the actual and projected levels were essentially the same, the graph also shows the impact of the incomplete achievement of the target of objectives defined for the Long-Term Monetary Incentive Plan (IMLT).
TARGET VS ACTUAL
COMPARISON TARGET 2014 - ACTUAL 2014
COMPARISON TARGET 2014 - ACTUAL 2014
COMPARISON TARGET 2014 - ACTUAL 2014
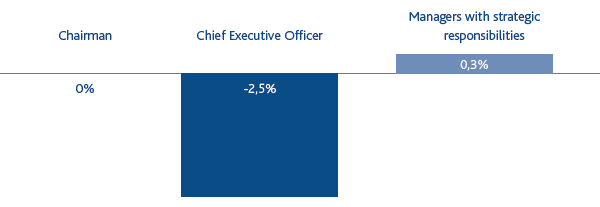
The analysis includes a comparison between any amounts paid in 2014 and any amounts paid in 2013. There was a 2.5% decrease in the amount paid to the Chief Executive Officer, but the amount paid to the Chairman and managers with strategic responsibilities remained nearly unchanged. Based on the assessment of the Remuneration Committee, the Chief Executive Officer’s remuneration fell short of average market practices.
REMUNERATION PAID - COMPARISON 2013-2014