Snam and the financial markets

2013 saw a generalised increase in share prices on the European financial markets, particularly in the second part of the year. The global economic crisis and the sovereign debt crisis in the eurozone prompted key central banks across the world to adopt and pursue expansive monetary policies. In particular, after the accommodative monetary policies already implemented by the ECB and the Fed, Japan’s central bank followed suit in the first half of the year.
These measures, together with the diffusion, particularly in the second part of the year, of initial data indicating a possible economic recovery, and narrowing spreads on government securities in the peripheral countries, reduced risk aversion among financial operators, with a subsequent flow of investment towards equity markets.
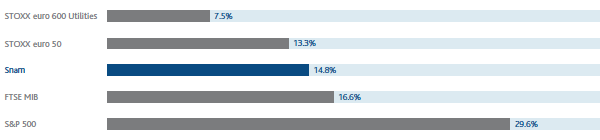
This drove up share prices across the board on the main European stock markets, which in some cases (Germany and the UK, for example) approached record highs: the STOXX Europe 50 index ended the year up 13.3%, London’s FTSE 100 index rose by +14.4%, the DAX in Frankfurt was +25.5% higher and the CAC 40 in Paris closed up +18%.
The Italian equity market followed the same trend as the other European markets. The FTSE MIB index ended 2013 up 16.6%.
The European utilities sector closed in positive territory by comparison with 2012. The STOXX Europe 600 Utilities index rose 7.5%, a more limited increase than the gains registered by the main equity markets. This underperformance by comparison with the European equity markets was driven by falls in power generation stocks, which were hit by lower margins as a result of stagnating energy demand and excess production capacity.
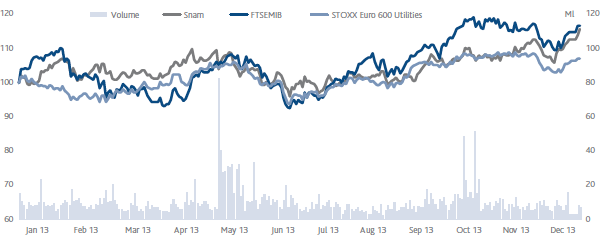
Snam’s stock, which is included in the FTSE MIB Italian index as well as the leading international indices (STOXX, S&P, MSCI and FTSE), closed 2013 at an official price of €4.04, up 14.8% compared with €3.52 at the end of the previous year. The shares were boosted not only by the positive trend in the financial markets, but also the positive investor response to the strategic plan for 2013-2016, as well as early results from the international development strategy. In addition, the regulatory risk diminished towards the end of the year, when the Electricity and Gas Authority drew up a new regulatory framework for natural gas transportation and distribution services.
In 2013, a total of approximately 2.7 billion Snam shares were traded on the MTA segment of the Italian Stock Exchange, with an average daily trading volume of 10.2 million shares (compared with about 9 million in 2012).
The bond market saw contracting spreads on government securities in the peripheral European countries (Italy, Spain, Portugal and Greece). Yields on government securities in these countries therefore decreased, while yields on the securities of the benchmark countries (Germany and the US) rose slightly, mainly on long-term maturities. Reduced country risk and narrowing spreads have also benefited Snam’s bonds, which ended the year on higher prices, and therefore lower yields, across all maturities.
SHAREHOLDERS
The share capital as at 31 December 2013 consisted of 3,381,638,294 shares with no indication of nominal value (unchanged from 31 December 2012), with a total value of €3,571,187,994 (unchanged from 31 December 2012).
As at 31 December 2013, Snam had 1,672,850 treasury shares (2,906,550 at 31 December 2012), equal to 0.05% of the share capital (0.09% at 31 December 2012), with a book value of about €7 million.
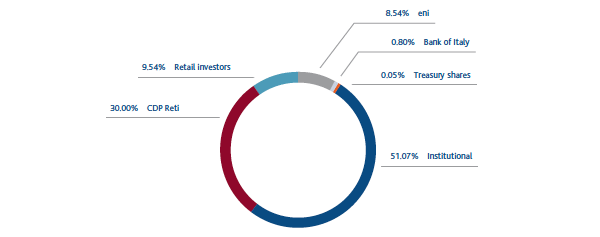
At year end, based on entries in the Shareholders’ Register and other information gathered, CDP Reti S.r.l. held 30.00% of the share capital, Eni S.p.A. held 8.54%, Snam S.p.A. held 0.05% in the form of treasury shares, and the remaining 61.41% was held by other shareholders.
SNAM - COMPARISON OF PRICES OF SNAM, FTSE MIB AND EURO STOXX 600 UTILITIES
(1 JANUARY 2013 – 31 DECEMBER 2013)
SNAM - COMPARISON OF SNAM'S PERFORMANCE WITH THE MAIN STOCK MARKET INDICES
SUSTAINABILITY INDICES ON WHICH THE SNAM SHARE IS PRESENT