Added value produced and distributed

The Company produces wealth by contributing to the economic growth of the society and environment in which it operates, and it measures this wealth in terms of added value produced and distributed to its key stakeholders. The representation below takes its inspiration from the standard prepared by the Gruppo di Studio per il Bilancio Sociale (GBS) and the guidelines of the Global Reporting Initiative (GRI-G4). The values represented, consistent with the values for the period, refer to assets from continuing operations.
The added value produced in the year was equal to €2,518 million, an increase of €89 million compared with 2015, despite the reduction in the net invested capital remuneration rate - WACC which affected the operational profitability of natural gas transportation activities.
| Download XLS (17 kB) |
(€ million) |
2014 |
2015 |
2016 |
Added value produced (A) |
2,445 |
2,429 |
2,518 |
Added value distributed (B) |
1,907 |
1,831 |
1,917 |
Employees |
241 |
238 |
260 |
Local community |
3 |
2 |
2 |
-Donations and sponsorship |
1 |
1 |
1 |
-Regulatory environmental compensation |
2 |
1 |
1 |
Lenders (Bondholders and Banks) |
377 |
347 |
610 |
Shareholders |
875 |
875 |
722 |
Government |
411 |
369 |
323 |
-Direct taxes |
394 |
357 |
308 |
-Indirect taxes |
17 |
12 |
15 |
Added value retained within the Company (A) - (B) |
538 |
598 |
601 |
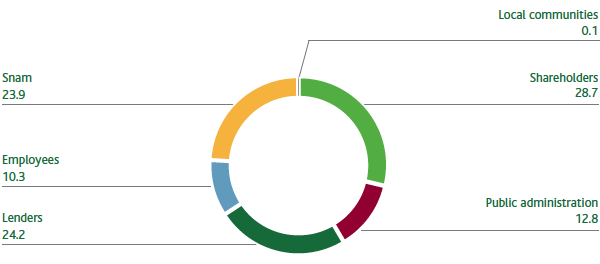
With regard to the main stakeholders, the added value breaks down as follows:
- Employees 10.3% - through direct remuneration made up of salaries and severance pay and indirect remuneration comprising social security contributions and staff-related service costs (canteen services, reimbursement of travel expenses);
- Public Administration 12.8% - through the payment of direct and indirect taxes;
- Shareholders 28.7% - through dividends distributed. The reduction compared with the previous year is also due to the lower number of outstanding shares following the buyback of treasury shares (share buyback programmes);
- Lenders 24.2% (+9.9% compared with 2015). The increase over the previous year is due to the effect of the bond buyback transaction.
23.9% of the added value produced was also reinvested within the Company, the value intended for the amortisation and depreciation of tangible and intangible fixed assets used in the production process.
An amount of approximately €2 million was also allocated to local communities (equal to 0.1% of the value generated) through donations, sponsorships and environmental compensation pursuant to the law.
DISTRIBUTION OF ADDED VALUE (%)

Relations with the financial community
Snam considers maintaining constant relations with investors and the entire financial community as strategic for its reputation. In this regard, it strives to disclose exhaustive and timely information, capable of most effectively representing the business strategy of the Group and its performance, specifically developing the dynamics that ensure the creation of value over time.
To complement the constant meetings and initiatives, many economic-financial publications are produced on the performance of the business and the sustainability projects and initiatives developed by the Company.
| Download XLS (17 kB) |
Description of KPI |
KPI data |
Pre-set target |
Target reached in 2016 |
Activity status |
||
|
||||||
Meetings with SRI investors out of SRI investors recorded in the ownership structure (%) |
2010 |
Reach a value of 33 in 2016 |
35 |
|
||
Number of meetings with institutional investors (no.) |
2010 |
Reach a value of 264 in 2016 |
287 |
|
||
Number of investor days/site visits with institutional investors (no.) |
2010 |
Reach a value of 1 in the year |
1 |
|
||
GRI-G4:EC1