Allocation of added value GRI – G4: EC1
Snam generates wealth by contributing to the economic growth of the society and environment in which it operates, and it measures this wealth in terms of added value produced and distributed to its leading stakeholders. The table below helps to understand the economic effects produced by the Group and the value it creates for its stakeholders.
Snam generated added value of € 2.065 million in 2015, in line with the figure for 2014.
| Download XLS (23 kB) |
(€ millions) |
2013* |
2014* |
2015 |
||||
|
|||||||
Core business revenue |
3,735 |
3,784 |
3,856 |
||||
Other revenue and income |
113 |
98 |
114 |
||||
Net financial expense** |
(16) |
1 |
(15) |
||||
Income from equity investments |
45 |
131 |
135 |
||||
for deduction: |
|
|
|
||||
Raw materials |
(91) |
(123) |
(180) |
||||
Services |
(401) |
(404) |
(389) |
||||
Use of third-party assets |
(88) |
(89) |
(99) |
||||
Capital losses |
(15) |
(21) |
(35) |
||||
Other operating expense |
(25) |
(70) |
(28) |
||||
Increase on internal work capitalised in non-current assets – Cost of work and financial expense |
94 |
100 |
95 |
||||
|
|
|
|
||||
Gross added value |
3,351 |
3,407 |
3,454 |
||||
Amortisation, depreciation and write-downs |
(769) |
(803) |
(849) |
||||
Net added value |
2,582 |
2,604 |
2,605 |
||||
| Download XLS (23 kB) |
(€ millions) |
2013* |
2014* |
2015 |
||||||
|
|||||||||
Added value produced (A) |
2,582 |
2,604 |
2,605 |
||||||
Added value distributed (B) |
2,510 |
2,281 |
2,242 |
||||||
Employees** |
461 |
436 |
483 |
||||||
Lenders |
490 |
435 |
395 |
||||||
Bondholders |
290 |
350 |
364 |
||||||
Banks |
200 |
85 |
31 |
||||||
Shareholders*** |
845 |
875 |
875 |
||||||
Government |
714 |
535 |
489 |
||||||
Direct taxes |
690 |
509 |
467 |
||||||
Indirect taxes |
24 |
26 |
22 |
||||||
Added value retained by the Group (A) – (B) |
72 |
323 |
363 |
||||||
Allocation of added value (%)

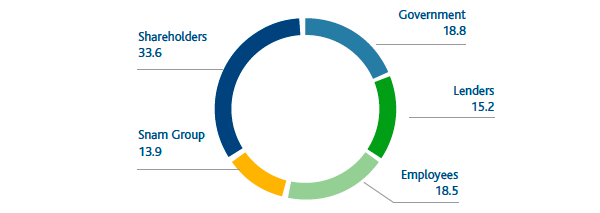
The share of added value distributed to shareholders in the form of dividends remained broadly unchanged in 2015 (33.6%; the same as in 2014), while the share allocated to government in the form of indirect and direct taxes fell by 1.7 percentage points to 18.8%, caused by an adjustment to deferred taxes following the reduction of the IRES rate from 27.5% to 24% as of 1 January 2017, and the share awarded to lenders rose by 1.5 percentage points to 15.2% thanks to steps taken by the Group to optimise its financial structure. On the other hand, the share of added value distributed to employees in the form of direct remuneration (salaries, wages and post-employment benefits) and indirect remuneration (social security expenses and costs for staff-related services such as catering and travel expenses) increased by 1.8 percentage points to 18.5%, due mainly to charges arising from the closure of the Fondo Gas pension fund. The Group retained 13.9% of added value.
The Snam stock in sustainability indices GRI – G4: 15
In 2015, the Snam stock was once again included in the major global SRI share indices based on company’s economic, social and environmental sustainability performance. This makes the company more visible to socially responsible investors and to the financial market as a whole. As at 31 December 2015, the total share of Snam capital held by institutional investors who partly base their investment choices on corporate social responsibility was 4.7% (versus 4.4% a year earlier).
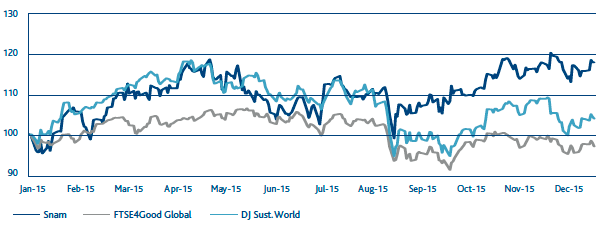
Performance of Snam stock and major ethical share indices
RobecoSAM, one of the world’s leading sustainability ratings companies, included the Snam stock in the major sustainability share index, the Dow Jones Sustainability World Index, for the seventh consecutive year. In January 2016, for the second year in a row, RobecoSAM awarded Snam the Silver Class award in its Sustainability Yearbook, an elite classification which recognises the highest-scoring companies with regard to sustainability.
Snam also retained its presence in the prestigious FTSE4Good Index Series, where it has been since 2002, and, for the third consecutive year, in the CDP Italy Climate Disclosure Leadership Index. CDP is one of the world’s leading not-for-profit climate change organisations.
In July 2015, the Snam stock was included for the second consecutive year in the MSCI World ESG and MSCI ACWI ESG indices. MSCI is a leading global provider of investment decision support tools to investment institutions worldwide.
In September 2015, to add to its presence in the Ethibel Pioneer and Ethibel Excellence investment registers, the Snam stock was added to the Ethibel Sustainability Index (ESI) Excellence Europe. Being selected for this index by the Ethibel Forum means that the company is an industry leader in CSR.
Snam also features in the following indices: the ECPI sustainability indices; the United Nations Global Compact 100 (“GC 100”) index, developed as part of the UN’s Global Compact initiative; and the Europe, Eurozone and World NYSE Euronext Vigeo 120 indices managed by Vigeo, a European leader in the CSR rating of companies.
The Snam stock also features in the Stoxx Global ESG Leaders Indices and has been classified as “PRIME” (with a B rating) by Oekom research, the leading international ratings agency for socially responsible investors, which works for institutional investors and financial services companies.

Relations with the financial community
Snam’s communication policy has always intended to guarantee continuous dialogue with the entire financial community. The company aims to establish a trust-based relationship with shareholders, investors, analysts and all financial market operators, and to automatically provide them with exhaustive and timely information so they get the best possible knowledge of the Group’s performance and strategy.
Snam considers an active policy of engagement with investors to be crucial in adding value in terms of shareholder satisfaction.
This communication policy takes the form of several financial publications concerning the performance of the business and developments pertaining to sustainability, as well as regular meetings and initiatives.
| Download XLS (29 kB) |
KPI description |
KPI date |
Pre-set target |
Target achieved in 2015 |
Sector |
Status Activities |
Meetings with SRI investors on SRI investors in the shareholding (%) |
2010 |
Reach 33 by 2015 |
36 |
Snam Group |
|
Number of meetings with institutional investors |
2010 |
Reach 252 by 2015 |
287 |
Snam Group |
|
Number of investor days / site visits with institutional investors |
2010 |
Reach 1 by 2015 |
1 |
Snam Group |
|
|
|
||||
