Operating review
Gas moved through the storage system
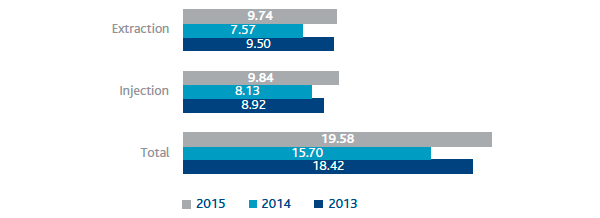
In 2015, 19.58 billion cubic metres of natural gas was moved through the storage system, an increase of 3.88 billion cubic metres, or 24.7%, compared with 2014 (15.70 billion cubic metres). The increase was mainly attributable to higher withdrawals from storage (+2.17 billion cubic metres; +28.7%) due to the substantial use of stocks by the operators during the first quarter of 2015, due mainly to weather conditions and to higher injections to replenish stocks (+1.71 billion cubic metres; +21.0%).
NATURAL GAS MOVED THROUGH THE STORAGE SYSTEM (billions of cubic metres)
Provision and development of storage services
| Download XLS (22 kB) |
|
2013 |
2014 |
2015 |
Active customers (shippers) |
118 |
107 |
118 |
In 2015, the available storage capacity increased from 11.4 billion standard cubic metres in 2014 to 11.5 billion cubic metres (16.0 including strategic storage), thanks to the availability of the first 100 million cubic metres of the Bordolano deposit. In the 2015-2016 thermal year, the total space allocated was the same as that offered. Although allocation auctions were scheduled for the period April-September (four successive monthly auctions), the capacity offered had already been allocated in full at the auctions in June 2015.
The network codes list a series of indicators for monitoring the quality of the service offered by companies. When compared against these indicators, the Snam companies maintained a high level of performance in 2015. One part of these indicators, which refer to specific levels of commercial quality, gives rise to the indemnification of customers in the event of failure to comply with the service quality standard.
| Download XLS (22 kB) |
|
2013 |
2014 |
2015 |
Contractual storage capacity/Available storage capacity (%) |
86 |
100 |
100 |
Compliance with execution times for services subject to specific commercial quality standards (%) |
100 |
100 |
100 |
Connection flow lines subject to supervision (%) |
76 |
76 |
100 |
Total capacity not made available following interruptions/reductions to the service (%) |
0 |
0 |
0 |
Specifically, during 2015, the IT systems continued to be developed with a view to ongoing improvement of the quality and fluidity of the service, and as a result of the regulations issued by the Authority.
The Stogit Capacity Portal, which manages all information exchanges with customers, in accordance with the provisions of the Storage Code, was further refined with regard to auction allocation processes for Peak and Uniform Modulation Storage services. Processes concerning the assignment of capacity, contracts and billing previously implemented and currently used by all customers were also established, optimised and consolidated.
During 2015, the functionalities for the management of several daily renomination cycles were also developed (to date only one is scheduled per day), in compliance with the provisions of Regulation (EU) No 312/2014, which introduces the new gas balancing service, which was initially scheduled to be applied as of 1 October 2015 and was deferred until a date still to be determined (in any case no later than 1 October 2016).
Organisational changes related to operational activities
The number of employees in the storage sector as at 31 December 2015 was 299, 8 more than as at 31 December 2014.
The period saw the launch of the SmartGas project, an initiative aimed at revising maintenance standards and regulations, in order to ensure the necessary evolution of professional roles operating at the hubs and the development and implementation of more highly developed IT solutions to manage operating processes.
Accidents
The number of accidents reduced in 2015, for both employees and contract workers.
| Download XLS (22 kB) |
|
2013 |
2014 |
2015 |
Total accidents involving employees |
0 |
1 |
0 |
Total accidents involving contract workers |
2 |
2 |
1 |
| Download XLS (22 kB) |
|
2013 |
2014 |
2015 |
||||
|
|||||||
Employees |
|
|
|
||||
Frequency index (*) |
0.00 |
2.02 |
0.00 |
||||
Severity index (**) |
0.00 |
0.01 |
0.00 |
||||
Contract workers |
|
|
|
||||
Frequency index (*) |
2.07 |
1.98 |
0.89 |
||||
Severity index (**) |
0.01 |
0.17 |
0.18 |
||||
Energy consumption and emissions
Activities aimed at reducing energy consumption and controlling atmospheric emissions continued. In 2015, a new Dry Low Emission (DLE) turbine came into operation at the Cortemaggiore compression plant (TC1).
Total emissions of nitrogen oxides in 2015 amounted to 175 tonnes (-22.9% compared with 2014). The reduction was due to the increasingly wide use of DLE turbines, which were employed for 89% of operating time. This reduction is even more significant when taking into account that the gas fuel used to operate the gas turbines, which is responsible for the largest share of emissions, actually increased (+15.1%).
| Download XLS (23 kB) |
|
2013 |
2014 |
2015 |
||
|
|||||
Energy consumption (TJ) |
4,410 |
4,117 |
4,740 |
||
Emissions of CO2eq – Scope 1 (tonne) (*) |
424,042 |
410,728 |
450,162 |
||
Emissions of natural gas (106 m3) |
11.7 |
11.7 |
10.7 |
||
Emissions of NOx (tonne) |
349 |
227 |
175 |
||
| Download XLS (22 kB) |
|
2013 |
2014 |
2015 |
Emissions of natural gas for storage/gas stored (%) |
0.061 |
0.067 |
0.051 |
Emissions of NOx/gas stored (kg/106m3) |
39.1 |
28.0 |
17.8 |
Average emissions of NOx per turbine/installed capacity |
9.6 |
6.2 |
5.6 |