Number of employees and operating efficiency
The number of employees in service at 31 December 2015 was 6,303 (6,072 at 31 December 2014), an increase of 231 (+3.8%) over the previous year. The average number of payroll employees for entities included in the scope of consolidation was 6,213 (6,116 in 2014).
2015 was characterised by both a major initiative to change the employment mix, and by the development and consolidation of systems and policies for leadership and performance orientation. Specifically, the employment figures recorded during 2015 were as follows:
- an increase of 382 employees, of whom 273 were hired from the market (of whom 38% held university degrees, 55% held diplomas from technical institutions and 7% held lower qualifications), and 109 were other new employees resulting from an increase of 95 employees at Italgas and subsidiaries following the consolidation of Acam Gas (91) and Metano Arcore (4), the return of 9 employees to work from leave, and 5 transfers from unconsolidated companies;
- a decrease of 151 employees, of whom 91 were the result of the termination of employment, 9 were terminated unilaterally and another 51 employees left.
With respect to the Group’s national distribution, 3,544 people are employed in the northern regions of Italy, 1,183 in the central regions and 1,573 in the south. Furthermore, 3 individuals are permanently employed abroad.
As regards industrial relations, in 2015 there was a consolidation of second-level negotiations that led to the parties establishing productivity and profitability indicators for the 2015 bonus for all Snam Group companies.
The cost of labour and related expenses totalled €454 million (before the capitalised portion), an increase of €40 million on 2014 (€406 million). This increase was mainly due to the closure of the Gas Fund by State law (a pension fund that used compensation-based rather than contribution-based calculations), and the re-establishment of supplementary employee pensions by distribution companies. Net of this impact and the growth in employment generated, including as a result of recent acquisitions in the distribution area, the impact of policies aimed at revising and improving operating efficiency made it possible to mitigate the inflationary growth of labour contracts.
Supply chain management
In 2015, supply chain management focused on the streamlining of supplies and the optimisation of the supplier base.
The introduction of new, more stringent procedures during the qualification process (ethical and reputational checks) and the departure from the market of certain suppliers due to the ongoing domestic economic crisis further contributed to a reduction in the number of suppliers on the Group’s vendor list, thereby further strengthening the activities more directly connected to the Company’s core business.
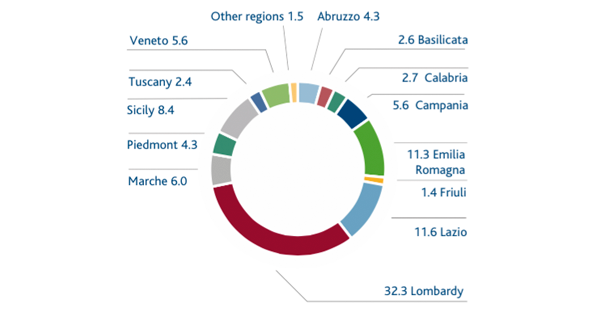
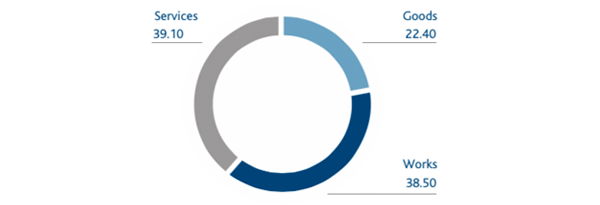
Snam provided work to 910 companies including 619 in the small and medium-sized enterprise category (SME), under 1,386 supply agreements (-11.9% compared with 2014), of which 62% were entered into with SMEs valued at a total of €1.89 billion (+61.5% over 2014), broken down by work (38.5%), goods (22.4%) and services (39.1%). Domestic companies accounted for 93% of these agreements.
The significant increase in the amount of purchases was mainly the result of investment planning. The reorganisation of the businesses of the subsidiary Italgas and the renewal of significant Group framework agreements in the service area also contributed to this.
At 31 December, the vendor list included 2,547 qualified suppliers, and 295 suppliers were in the process of being renewed or obtaining new qualifications. The supply chain was checked and monitored with 19 audits during the qualification phase of critical suppliers, 1,300 feedback reports collected on services rendered by 243 suppliers and the issue of 92 sanctions for defaults including notices, suspensions and revocation of qualifications.
For the supply of work, which is the most significant category since it is related to core activities, critical suppliers (criticality levels A and B) all had quality and environmental management systems certified according to ISO 9001 and ISO 14001 standards. In addition, in 2015 the goal of having nearly all (90%) of these suppliers obtain OHSAS 18001 certification (worker health and safety) was achieved and surpassed with a significant increase over 2014 when this level was 60%.
GEOGRAPHIC BREAKDOWN OF PROCUREMENT IN ITALY (%)
PROCUREMENT BY GOODS TYPE (%)
Accidents
In 2015 a total of 34 accidents occurred, including 22 involving employees and 12 involving contracting suppliers. There were no fatalities in the case of contract workers. In the case of employees, there were two fatal accidents in the distribution area, and one in the transportation area.
| Download XLS (22 kB) |
|
2013 |
2014 |
2015 |
Total employee accidents |
15 |
15 |
22 |
Total contract worker accidents |
22 |
16 |
12 |
| Download XLS (23 kB) |
|
2013 |
2014 |
2015 |
||||
|
|||||||
Employees and contract workers |
|
|
|
||||
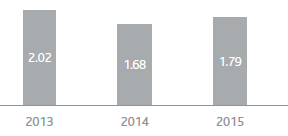
Frequency index |
2.02 |
1.68 |
1.79 |
||||
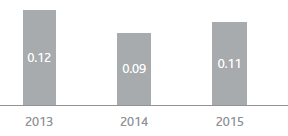
Severity index |
0.12 |
0.09 |
0.11 |
||||
Employees |
|
|
|
||||
Frequency index |
1.51 |
1.49 |
2.14 |
||||
Severity index |
0.09 |
0.08 |
0.10 |
||||
Contract workers |
|
|
|
||||
Frequency index |
2.63 |
1.91 |
1.38 |
||||
Severity index |
0.16 |
0.10 |
0.11 |
||||
EMPLOYEE AND CONTRACT WORKER ACCIDENT GRAPHS
ACCIDENTS AT WORK - EMPLOYEE AND CONTRACT WORKER FREQUENCY INDEX
ACCIDENTS AT WORK - EMPLOYEE AND CONTRACT WORKER SEVERITY INDEX