Operating review
Gas distributed and infrastructure
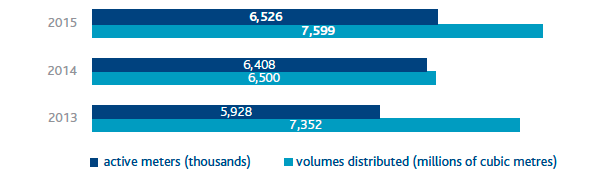
In 2015, 7,599 million cubic metres of gas were distributed, an increase of 1,099 million cubic metres, or 16.9%, compared with 2014, due mainly to the change in the scope of consolidation and to weather conditions.
At 31 December 2015, Snam had concessions for gas distribution services in 1,472 municipalities (compared with 1,437 as at 31 December 2014), of which 1,401 were operational. It had 6.526 million active meters at gas redelivery points to end users (households, businesses, etc.), compared with 6.408 million at 31 December 2014.
As at 31 December 2015, the gas distribution network covered 56,717 km (55,278 km as at 31 December 2014), an increase of 1,439 km compared with 31 December 2014.
ACTIVE METERS AND GAS VOLUMES
Provision and development of distribution services
| Download XLS (22 kB) |
|
2013 |
2014 |
2015 |
Active customers |
218 |
249 |
260 |
The Company continued to implement its remote gas meter reading plan, which was launched in late 2010 for meters for large-scale users (calibres higher than G6), and subsequently extended in 2014 to include the mass market area (G4 and G6 calibre readers), with point-to-point communication.
As at 31 December 2015, the number of redelivery points with a G4- or G6-calibre meter equipped with the remote-reading function was around 455,000, of which 206,000 had activated remote reading. At the same date, approximately 85,000 meters with a calibre higher than G6 were equipped with the remote-reading function, which was activated in all of them.
The Network Codes list a series of indicators for monitoring the quality of the service offered by companies. When compared against these indicators, the Snam companies maintained a high level of performance in 2015. One part of these indicators, which refer to specific levels of commercial quality, gives rise to indemnification of customers in the event of failure to comply with the service quality standard.
| Download XLS (22 kB) |
Distribution |
2013 |
2014 |
2015 |
Compliance with the maximum time set for services subject to specific commercial quality standards (%) |
99.3 |
99.1 |
98.0 |
Punctuality in appointments with customers (%) |
99.3 |
99.0 |
98.4 |
High- and medium-pressure networks subject to inspection (%) |
46.3 |
54.6 |
49.2 |
Low-pressure networks subject to inspection (%) |
44.4 |
34.5 |
45.5 |
Compliance with the maximum time for reaching the call-out site for emergency assistance (%) |
98.3 |
97.2 |
96.1 |
Organisational changes related to operational activities
As at 31 December 2015, the distribution sector had 3,298 employees, compared with 3,124 a year earlier, an increase of 174. This was due mainly to new hires, acquisitions and internal transfers within the Group.
With effect from 13 July 2015, following the revocation of the judicial administration measure handed down by the Court of Palermo, Italgas made changes to its organisational structure, which has been updated in response to the growing managerial and operational difficulties that the Company will have to tackle as a result of developments in the gas distribution business in Italy and the imminent launch of tender processes.
As a result, the Business Services department was created (reporting directly to management), incorporating the HSEQ and Procurement units and the new Human Resources unit, in order to guarantee a certain level of direction and control of the relevant processes, promote interaction and mutual cohesion between the different areas, ensure a more effective and coordinated response to expected market developments, and guarantee coordination between Italgas and the Group.
The Company also combined its Budget and Administration department, its Planning, Control and Business Analysis department and its new Project Control department (which was created to guarantee close coordination between the centre and the regions for the direction and control of the corporate investment plan) into a single unit, reporting directly to management.
Lastly, the Operations department underwent changes with a view to further upgrading engineering expertise and reinforcing operational control, ensuring, at both Headquarters and District levels, the presence of teams dedicated to providing specialist support on monitoring and engineering processes.
To that end, the Headquarters Engineering unit was set up, representing the hub of excellence that brings together Italgas’s expertise in technical regulations, planning, coordination of work, and verification that the networks comply with the technical specifications. At Headquarters level, a Network Management unit has also been created, to which the Districts and the new Network Coordination and Operational Control unit shall report. The latter is responsible for directing, monitoring and controlling contractual management and site management activities. Lastly, the Districts have been equipped with a new Works Coordination and Engineering Staff unit, which is responsible for coordinating the Operational Centres in executing and monitoring works and in contractual management activities, as well as offering specialist technical support for the design of works in coordination with the Headquarters Engineering department.
Accidents
During the course of 2015, the number of accidents increased considerably for both employees and contract workers, due partly to the expansion of the Company’s scope. There were two fatal accidents involving employees: one while looking for a gas leak in an urban centre, and the other during works on a gas pipe.
| Download XLS (22 kB) |
|
2013 |
2014 |
2015 |
Total accidents involving employees |
5 |
6 |
18 |
Total accidents involving contract workers |
0 |
1 |
4 |
| Download XLS (23 kB) |
|
2013 |
2014 |
2015 |
||||
|
|||||||
Employees |
|
|
|
||||
Frequency index (*) |
0.98 |
1.15 |
3.34 |
||||
Severity index (**) |
0.04 |
0.06 |
0.16 |
||||
Contract workers |
|
|
|
||||
Frequency index (*) |
0.00 |
0.76 |
3.13 |
||||
Severity index (**) |
0.00 |
0.13 |
0.35 |
||||
Energy consumption and emissions
Energy management activities were continued with a view to streamlining and reducing energy consumption. These included the installation of photovoltaic plants in buildings and network plants, the installation of more efficient heat generators and activities intended to control natural gas emissions. To that end, 2015 saw the continuation of the replacement of grey cast-iron pipes with better-performing pipes (approximately 29 km of network was replaced).
| Download XLS (23 kB) |
|
2013 |
2014 |
2015 |
||||
|
|||||||
Energy consumption (TJ) |
521 |
527 |
571 |
||||
Emissions of CO2eq – Scope 1 (tonne) (*) |
718,380 |
724,588 |
534,192 |
||||
Emissions of natural gas (106 m3) (**) |
43.7 |
44.2 |
28.7 |
||||
| Download XLS (22 kB) |
|
2013 |
2014 |
2015 |
Emissions of natural gas/km of network (m3/km) |
828 |
813 |
511 |
Emissions of CO2eq/gas distributed (kg/106 m3) |
97,712 |
111,745 |
70,298 |