Energy consumption
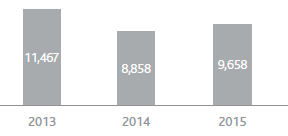
In 2015 energy consumption totalled around 9,658 terajoules (TJ), an increase of 9% over 2014.
The increase is attributable to the higher amount of gas transported (+8% compared with 2014) and stored (up over 20% compared with 2014). In particular, the increase in gas stored is significantly higher than the increase in consumption due to the growing use of high-efficiency turbines that improve energy performance.
The most heavily used energy source was natural gas, which covered 93.8% of total energy needs. Other sources used are electricity (4.2%) and other fuels (diesel fuel, gasoline, LPG and heat), which together represent 2% of consumption.
Energy consumption data
ENERGY CONSUMPTION (TJ)
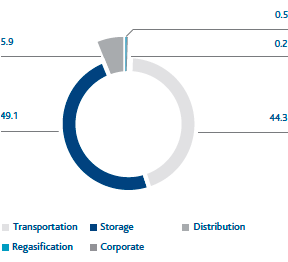
ENERGY CONSUMPTION BY BUSINESS SEGMENT (%)
Greenhouse gas emissions
DIRECT CO2eq EMISSIONS – SCOPE 1 (103 t) (*) (**)
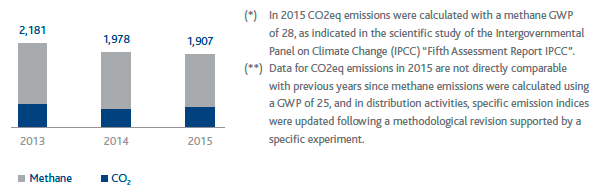
In 2015, direct emissions of CO2eq totalled about 1.91 million tonnes, direct emissions of CO2 from combustion were about 0.52 million tonnes, while emissions of CO2eq from methane emissions were about 1.39 million tonnes.
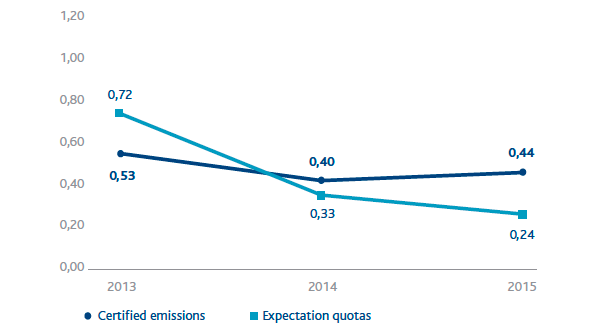
In 2015, the Snam Group’s total CO2 plant emissions subject to the ETS Directive, and certified by an accredited body according to the provisions of the competent national authority, amounted to 0.44 million tonnes, out of total annual allowances of 0.24 million issued by the Ministry of the Environment and Protection of Land and Sea (negative balance of 0.20 million allowances). This deficit is amply offset by the allowances already present in the registers for the individual plants, accumulated thanks to the surplus from previous years.
With the start of the third regulatory period (2013-2020), the system for the authorisation to emit greenhouse gas, which was previously regulated by Legislative Decree 216/2006, was updated and revised by Legislative Decree 30 of 13 March 2013, in force since 5 April 2013. According to the new provisions, the main goal of the decree was to update regulations concerning authorisations to emit greenhouse gas, and to constantly reduce emission allowances issued free of charge. The allowances will be assigned to each plant on a gradually decreasing basis, and will no longer be constant (as in the second regulatory period), and will also depend on the actual functionality of the plants.
| Download XLS (22 kB) |
Business |
Number of plants |
Name of plants |
Transportation |
11 |
Gas compression stations in Enna, Gallese, Istrana, Malborghetto, Masera, Melizzano, Messina, Montesano, Poggio Renatico, Tarsia, Terranuova Bracciolini |
Storage |
8 |
Storage gas compression stations in Cortemaggiore, Fiume Treste, Minerbio, Ripalta, Sabbioncello, Sergnano, Settala and Bordolano |
Regasification |
1 |
Liquefied natural gas plant in Panigaglia |
CO2 EMISSIONS (106 t)