RESULTS FOR THE YEAR
Snam posted EBIT of €2,111 million for 2012, an increase of €153 million (+7.8%) on the previous year. This increase, which was due mainly to higher revenue from regulated activities and to containing operating costs, reflects improved performance from the natural gas storage and distribution business segments.
Adjusted net profit, which excludes special items, came to €992 million. It was up 1.4% on 2011 owing mainly to higher EBIT (+€153 million), which was offset partly by higher net financial expense (-€146 million) essentially as a result of higher average borrowing costs and higher average debt during the period.
Positive operating cash flow of €961 million enabled the company to partly finance its net investments for the period of €1,351 million. Following payment of a dividend of €811 million, net financial debt amounted to €12,398 million at 31 December 2012, an increase of €1,201 million compared with 31 December 2011.

PERFORMANCE OF SNAM SHARES
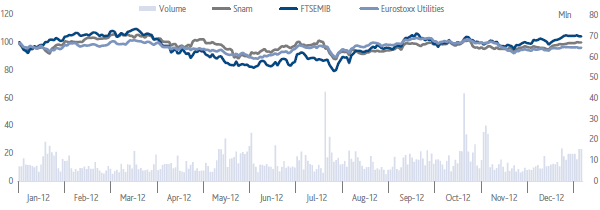
Snam’s stock, which is included in the FTSE MIB Italian index as well as the leading international indices (STOXX, S&P, MSCI and FTSE), ended 2012 at an official price of €3.52, up 3.8% compared with €3.39 at the end of the previous year.
This meant that Snam’s stock outperformed the sector average (the STOXX Euro 600 Utilities index fell by -0.7%), but was beaten by the index of leading Italian shares (the FTSE MIB climbed by +7.8%) owing largely to uncertainty surrounding the terms and conditions of the sale of Eni’s stake, which prompted caution among investors.
This uncertainty was gradually mitigated by progress in the ownership unbundling of Snam from Eni, by the success of Snam’s debt refinancing programme, by the company’s prospects for domestic and international growth and by the easing of tensions on the European markets and surrounding Italian sovereign debt.
Around 2.3 billion Snam shares were traded on the electronic segment of the Italian stock exchange in 2012, with the average daily trading volume in line with the previous year at just over 9 million shares.
SNAM, FTSEMIB AND STOXX EURO 600 UTILITIES PRICES

Source: Snam calculations using BLOOMBERG data.
Since listing on the stock exchange in 2001, Snam has always aimed to be transparent in its relations with the financial community by expressly communicating its objectives and the results it has achieved.
In order to sustain the quality of these relations, benchmark best practices are adopted each year to allow shareholders and the financial market to fully evaluate the company’s levers for creating value. Among these, it is worth mentioning:
• road shows (16 in 2012) aimed at meeting shareholders and institutional investors in the largest European and North American financial markets;
• one-to-one meetings between management and investors (130 in 2012, including more than 20 at the registered office in San Donato Milanese), as well as group meetings and sector conferences;
• conference calls when results are announced (annual, half-yearly and quarterly results), and the presentation of the strategic plan, which is attended by analysts who publish research on the stock.
KEY PERFORMANCE INDICATORS (KPI)
| Download XLS (17 kB) |
|
KPI description |
KPI date |
Pre-set |
Target achieved |
Sector |
Activity |
|
meetings with socially responsible investors as a % of total meetings |
2010 |
Achieve 33% in 2012 |
40 |
Snam group |
|
|
number of meetings with institutional investors |
2010 |
Hold 210 events in 2012 |
230 |
Snam group |
|
|
number of Investor Days |
2010 |
Hold 1 |
1 |
Snam group |
|
During 2012, management also took part in round-table meetings, seminars and conventions on subjects relating to the utilities industry, stock markets and corporate governance with specific presentations on these topics. Information of interest to shareholders and investors, including quarterly/half-yearly reports, both in Italian and in English, are available in the Investor Relations section on the corporate website, www.snam.it.
The launch during the year of the bond placement process, which will help Snam to achieve financial independence following the ownership unbundling from Eni, involved communicating with bond investors and credit market analysts. This communication took the form of five road shows in Europe’s major financial centres, 15 one-to-one meetings with investors, four meetings with groups of investors and participation in an industry conference. The company also began to communicate with ratings agencies Standard & Poor’s and Moody’s in 2012, and was awarded a credit rating (A- from Standard & Poor’s and Baa1 from Moody’s) that reflects its financial solidity and structure.


