Climate change and energy efficiency
GRI - G4: EN15, EN16, EN17, EN27
Greenhouse gases
The greenhouse gases (GHG) emitted into the atmosphere by the activities of Snam are carbon dioxide (CO2) and methane (CH4), the main component of natural gas. The CO2 is a by-product of the combustion process and is directly associated with the consumption of fuels, while the emissions of natural gas, and therefore CH4, derive partly from the normal operation of the plants and partly from the atmospheric emissions due to the connection of new pipelines and maintenance or to accidental events of the transportation and distribution networks.
In addition to using natural gas as its main fuel, Snam attempts to minimise GHG emissions in its operating activities by employing specific containment programmes, such as:
- the reduction of natural gas emissions (through the recompression of gas in pipelines, the replacement of pneumatic equipment and the replacement of cast-iron pipes in distribution networks);
- the reduction of power consumption (using specific energy management measures);
- the use of electricity produced from renewable energy sources (through specific purchase contracts and the installation of photovoltaic panels).
GREENHOUSE GASES SNAM GROUP
The advantages of natural gas
At equal energy usage, the carbon dioxide produced by the combustion of natural gas is 25-30% less than petroleum products and 40-50% less than coal. The decrease in emissions per unit of energy produced is further accentuated by the possibility of using natural gas in high-performance applications and technologies, such as condensation boilers, co-generation plants and combined cycles for producing electricity. A gas-powered combined cycle with an output of 56-58%, compared with an output of about 40% from traditional steam-powered cycles, makes it possible to reduce CO2 emissions by 52% compared with a traditional fuel oil-powered plant and by 62% compared with a coal-powered plant.
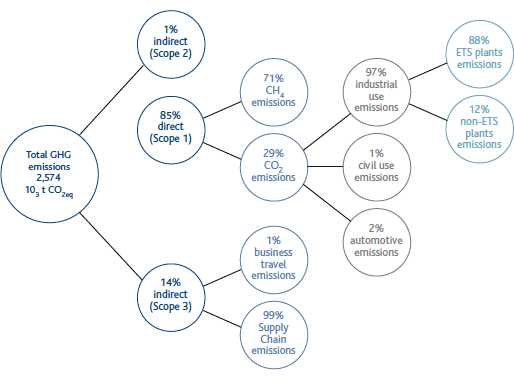
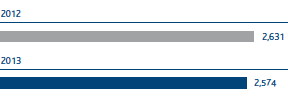
In 2013, total GHG emissions (direct Scope 1, and indirect Scope 2 and Scope 3) were approximately 2.57 million tonnes (-2.2% from 2012).
Indirect Scope 3 emissions relating to the supply chain are reported from 2012 onward. These emissions were calculated using methods developed by a leading international company in carbon footprint analysis.
Direct CO2eq emissions (Scope 1) GRI - G4: EN15, EN19
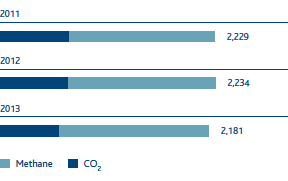
In 2013, direct CO2eq emissions were approximately 2.18 million tonnes (-2,4% compared with 2012). Direct CO2 emissions from combustion stood at approximately 622,338 tonnes (-10% compared to 2012), while CO2eq emissions deriving from methane emissions were approximately 1.56 million tonnes (in line with 2012).
The CO2eq emissions were calculated based on a global warming potential (GWP) of 25 for methane, as indicated in the 2007 scientific study of the Intergovernmental Panel on Climate Change (IPCC), “IPCC Fourth Assessment Report”.
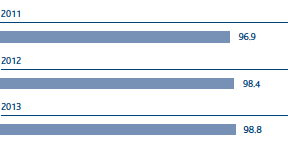
In 2013, the Group’s natural gas emissions were largely unchanged compared with 2012, rising from 98.4 Mm3 to 98.8 Mm3 (+0.4%). This performance mainly reflects a decrease in emissions from transportation activities (-1.5 Mm3) and distribution activities (-0.1 Mm3) and an increase in emissions from regasification activities (+1.7 Mm3) and storage activities (+0.3 Mm3).
The increase in emissions from regasification activities was due to a missing delivery of LNG which led to an increase in steam within the reservoirs, which was then released into the atmosphere for safety reasons. To avoid dispersing this steam, in April Snam launched operations that enabled the evaporated natural gas to be channelled into the transportation network.
TOTAL GHG EMISSIONS - SCOPE 1 - 2 - 3 (103T)
DIRECT EMISSIONS CO2EQ - SCOPE 1 (103T)
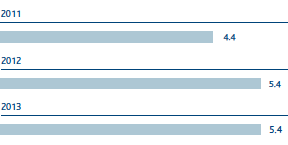
In order to contain natural gas emissions from the transportation network, activities were continued which involve gas recovery through online gas recompression interventions in the network upgrading phase (5.4 million cubic metres of natural gas were recovered, representing approximately 85,000 tonnes of CO2eq), as well as the replacement of pneumatic equipment at some plants. As regards containing natural gas emissions in distribution networks, the Company continued to replace cast-iron piping with higher-performance piping (replacing about 48 km of networks).
NATURAL GAS EMISSIONS (106M3)
NATURAL GAS RECOVERED TRANSPORTATION ACTIVITY (106M3)
| Download XLS (22 kB) |
|
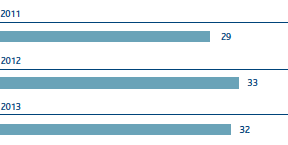
Natural gas emitted per kilometre of gas network (m3/km) |
||||
|
|
|
|
|
|
|
|
2011 |
2012 |
2013 |
Change (%) |
|
Transportation |
1,240 |
1,288 |
1,238 |
(3.9) |
|
Distribution |
846 |
840 |
828 |
(1.4) |
| Download XLS (31 kB) |
|
Key performance indicators (KPI) |
|||||||||||
|
|
|
|
|
|
|
||||||
|
|
KPI date |
Pre-set target |
Target achieved in 2013 |
Sector |
Status of activities |
||||||
|
|||||||||||
|
Natural gas recovered out of total potential emissions from maintenance activities |
2010 |
Recover 30% in 2013 |
49 |
Transportation |
|
||||||
|
Replacement of cast-iron networks (km) |
2010 |
Replace the entire grey cast-iron network by 2015* |
219 |
Distribution |
|
||||||
Indirect emissions (Scope 2) GRI - G4: EN16
Indirect CO2eq emissions arise from the use of electricity; in 2013 they made up approximately 32,240 tonnes (-2,6% compared with 2012).
With the contractual agreements concluded in the past few years, Snam has increased the number of plants supplying it with electricity generated from renewable sources. In 2013, the Messina compression station (Snam Rete Gas) was added to the Brugherio (Stogit) compression station and the Panigaglia (GNL Italia) regasification plant, which are already supplied in this way. This operation, as well as the use of photovoltaic panels for power generation, enabled the avoidance of approximately 8,800 tonnes of CO2eq.
Indirect CO2eq emissions are calculated with a factor of 0.393 kg CO2/kWh (as indicated in the Italian Greenhouse Gas inventory 1990-2011 – National Inventory Report 2013). For a comparison of the results obtained in previous years, the data for 2011 and 2012 have been recalculated with the same factor.
INDIRECT EMISSIONS CO2EQ - SCOPE 2 (103T)
Indirect emissions (Scope 3) GRI - G4: EN17
Indirect Scope 3 emissions refer to CO2eq emissions related to the supply chain (goods, labour and services) and business travel (business trips, transfers of Snam’s employees as part of their working activities).
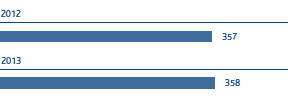
In 2013, CO2eq emissions were approximately 360,000 tonnes, largely in line with the previous year.
INDIRECT EMISSIONS - SCOPE 3 BUSINESS TRAVEL - T CO2EQ

INDIRECT EMISSIONS - SCOPE 3 SUPPLY CHAIN (103 T CO2EQ)
Emission Trading GRI - G4: EC2
With the start of the third regulatory period (2013-2020), the authorisation system for greenhouse gas emissions, previously regulated by Legislative Decree 216/2006, was updated and amended by Legislative Decree 30 of 13 March 2013, in force since 5 April 2013.
The free CO2 quotas allocated to the Snam Group are decreasing steadily, and are no longer constant as they were during the second regulatory period. This is to enable the emissions targets established by the Kyoto Protocol to be met. Moreover, the quota allocations in the third regulatory period also depend on the efficient functioning of the plants.
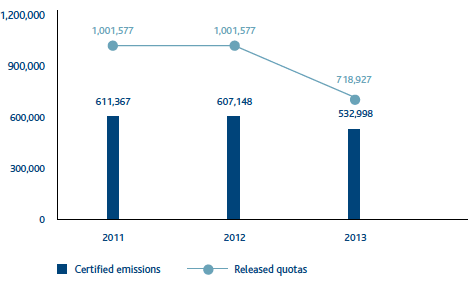
In 2013, total CO2 emissions issued and certified by an accredited body, according to the provisions of the competent national authority, amounted to 532,998 tonnes, out of a total of 718,927 annual shares issued by the Ministry for the Environment, Land and Sea (positive balance of 185,929 shares).
The Snam plants falling under the scope of application of the Emissions Trading Directive as at 31 December 2013 are shown in the table:
| Download XLS (22 kB) |
|
Snam Group emissions trading plants |
||
|
|
|
|
|
Activity |
No of plants |
Names of plants |
|
Transportation |
12 |
Gas compression stations in Enna, Gallese, Istrana, Malborghetto, Masera, Melizzano, Messina, Montesano, Poggio Renatico, Tarsia, Terranuova Bracciolini and the Mazara del Vallo entry point terminal |
|
Storage |
7 |
Gas compression storage stations in Cortemaggiore, Fiume Treste, Minerbio, Ripalta, Sabbioncello, Sergnano and Settala. |
|
Regasification |
1 |
Liquefied natural gas regasification plant in Panigaglia |
CO2 EMISSIONS (T)
Energy consumption GRI - G4: EN3, EN4, EN6
The Group’s main energy consumption is due to the gas turbines used in compression stations to provide gas with the pressure necessary for transportation (compression consumption) or storage (storage consumption).
To limit energy consumption, the best available technologies have always been used and high-performance turbines have been installed. In particular, the fuel consumption of the compression stations is controlled by the dispatching unit through the use of software systems that make it possible to manage the transportation network as efficiently as possible, in keeping with transportation and storage needs, with an optimal configuration of the individual plants.
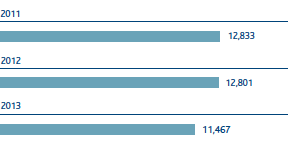
In 2013 total energy consumption was approximately 11,470 TJ, down 10.4% on 2012; the decrease reflects both the decrease in gas transportation and regasification activities and different transportation conditions, with increased quantities of gas injected into the network from Russia (+26.9% compared with 2012) and lower quantities of gas injected into the network from North Africa (-33.5% compared with 2012).
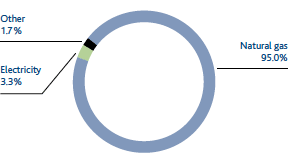
The energy source most used was natural gas, which covered 95% of the total energy needs. The other sources used were electricity (3.3%), other fossil fuels (diesel oil, petrol, LPG) and heat (1.7%).
ENERGY CONSUMPTION (TJ)
ENERGY CONSUMPTION
In energy management, the Company continued activities to identify possible energy consumption rationalisation and containment actions, such as the installation of photovoltaic equipment in buildings and plants; the adoption of LED lights and automatic switches for plant lighting; the installation of more efficient heat generators; the implementation of videoconferencing services to limit travel; and more efficient management of the movement of merchandise to and from the central warehouse.
| Download XLS (30 kB) |
|
Key performance indicators (KPI) |
|||||||||
|
|
|
|
|
|
|
||||
|
KPI description |
KPI Date |
Pre-set target |
Target achieved in 2013 |
Sector |
Status of activities |
||||
|
|||||||||
|
High-efficiency turbines |
2010 |
Achieve 85% out of total units installed by 2015 |
75 |
Storage |
|
||||
Production and the use of energy from renewable sources GRI - G4: EN3
Being aware of the importance of using energy from renewable sources, the Company has launched programmes that involve the installation of photovoltaic facilities in its buildings (local headquarters and maintenance centres) and in some natural gas withdrawal and pressure reduction stations in the distribution network.
| Download XLS (22 kB) |
|
Snam Group renewable source plants |
|||||
|
|
|
|
|
||
|
Type |
Number |
Total capacity (kW) |
Energy produced (kWh) |
||
|
|||||
|
Wind generators |
1 |
1.5 |
202,259 |
||
|
Photovoltaic plants |
802(*) |
478.5 |
|||
The installed power of the Snam Group’s renewable source plants increased by 5% compared with 2012, from 456 kW to 480 kW. The increase was due to the installation of two new photovoltaic plants of 20 kW at two maintenance centres (transportation activity).
The total energy produced by renewable source plants increased substantially compared with the previous year, from 144,000 kWh in 2012 to 202,000 kWh in 2013 (+41%). This increase reflected the fact that in 2013 a whole series of plants installed in 2012 were connected to the network, and their energy contribution was significant. In 2014, new plants will be connected to the network, which will help to further increase power generation from renewable sources. The use of renewable energy sources was produced from 19 photovoltaic systems which cover 85% of the power installed.
In 2013, the total number of plants decreased, mainly due to the replacement of various small pieces of equipment installed for electrical protection of the pipelines with models that do not require a back-up feed with a photovoltaic panel. These more technologically advanced tools operate solely on internal batteries as they consume less energy.
Air protection GRI - G4: EN21
The use of natural gas as its principal energy source enables the Company to minimise emissions of sulphur oxides and particulate matter.
Nitrogen oxide (NOx) emissions, the only significant polluting emissions, arise from the combustion of natural gas in the gas turbines installed in the compression stations (compression and storage). To reduce these emissions, a programme was established several years ago to modify the existing turbines and install new units with low emission combustion (DLE) systems.
In 2013, the DLE turbocompressors were put into service at the Cortemaggiore (TC2), Fiume Treste (TC1) and Messina (TC1) plants. Work to upgrade turbocompressors at the Sabbioncello (TC2), Minerbio (TC4) and Messina (TC2) plants were also completed in 2013, for entry into service in 2014.
TOTAL NOx EMISSIONS (T)
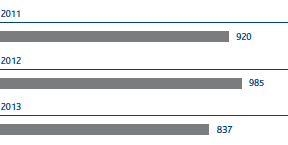
Total emissions of nitrogen oxides were around 837 tonnes (-15% compared with 2012). The decrease mainly reflects increased use of the DLE turbines, which represented 76% of the total functioning hours of the installed turbines.
NOx emissions into the atmosphere are determined based on direct measurements or, if these are not available, on emission factors present in the relevant literature (the EMEP/EEA Air Pollutant Emission Inventory Guidebook of the European Environment Agency).
| Download XLS (31 kB) |
|
Key performance indicators (KPI) |
|||||||||
|
|
|
|
|
|
|
||||
|
KPI description |
KPI Date |
Pre-set target |
Target achieved in 2013 |
Sector |
Status of activities |
||||
|
|||||||||
|
No of DLE turbines out of total no of turbines |
2010 |
Achieve 75% by 2015 |
74 |
Transportation |
|
||||
|
No of DLE turbines out of total no of turbines |
2010 |
Achieve 85% by 2015 |
70 |
Storage |
|
||||
|
Rated NOx emissions on turbine installed capacity |
2010 |
Achieve 6 mg/ |
9.6 |
Storage |
|
||||
|
No of hours of operation of DLE turbines out of total hours of operation of turbines |
2010 |
Achieve 85% by 2015 |
76 |
Transportation |
|
||||