Other environmental performance
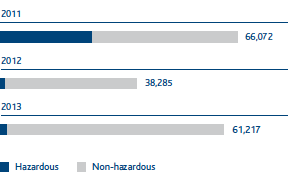
WASTE PRODUCTION (T)
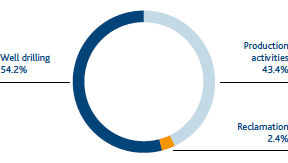
WASTE PRODUCTION BROKEN DOWN BY ACTIVITY
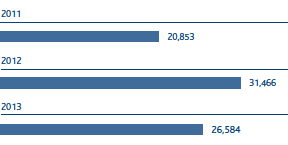
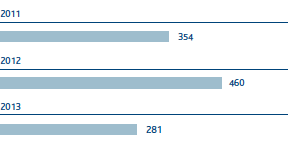
WASTE FROM PRODUCTION ACTIVITIES (T)
FRESHWATER PROCUREMENT (103M3)
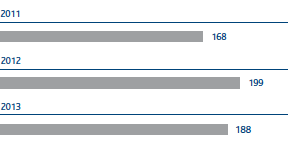
FRESHWATER DISCHARGED (103M3)
Ecologically
The “Ecologically” project, launched in 2010, continued. This includes initiatives that aim to promote good eco-sustainable practices even in the office, with small daily gestures that help to improve the quality of the surrounding environment.
“All paper recycled” means making all personnel at all Group sites aware of the advantages of using recycled paper, whilst raising awareness of environmental protection issues.
In 2013 the use of recycled paper with respect to total paper bought was 35%, allowing the Group to save natural resources and control carbon dioxide emissions.
| Download XLS (22 kB) |
|
Trees (No) |
Water (liters) |
Electricity (kWh) |
CO2eq (t) |
|
- 809 |
- 23,586,662 |
- 263,748 |
- 127 |