Economic and financial results
In 2013, Snam posted EBIT of €2,034 million, down €77 million, or 3.6%, compared with 2012. Net profit for 2013 amounted to €917 million, up by €138 million, or 17.7%, compared with the previous year.
Net cash flow from operations (+€1,698 million) allowed us to cover almost all of the borrowing costs associated with net technical investments and development of our activities abroad for the period (€1,790 million in total). Following payment of a dividend to shareholders of €845 million, net financial debt amounted to €13,326 million, an increase of €928 million compared with 31 December 2012.
Please see the Annual Report for further details.
Performance of Snam shares
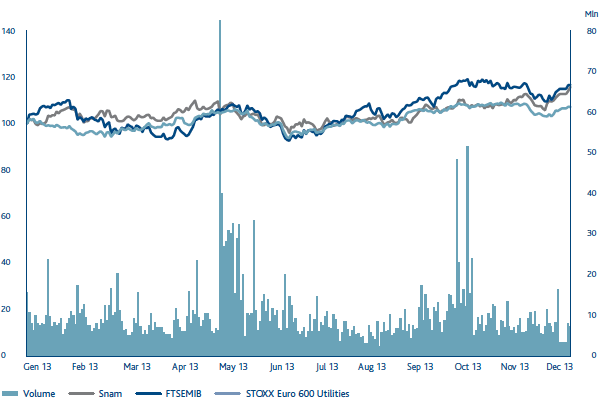
Snam’s stock, which is included in the FTSE MIB Italian index as well as the leading international indices (STOXX, S&P, MSCI and FTSE), closed 2013 at an official price of €4.04, up 14.8% compared with €3.52 at the end of the previous year. The shares were boosted not only by the positive trend in the financial markets, but also by the positive investor response to the strategic plan for 2013-2016, as well as early results from the international development strategy. In addition, the regulatory risk diminished towards the end of the year, when the Electricity and Gas Authority drew up a new regulatory framework for natural gas transportation and distribution services.
In 2013, a total of approximately 2.7 billion Snam shares were traded on the MTA segment of the Italian Stock Exchange, with an average daily trading volume of 10.2 million shares (compared with about 9 million in 2012).
SNAM LISTINGS ON FTSEMIB AND EUROSTOXX UTILITIES
Since listing on the stock exchange in 2001, Snam has always aimed to be transparent in its relations with the financial community by expressly communicating its objectives and the results it has achieved.
In order to sustain the quality of these relations, benchmark best practices are adopted each year to allow shareholders and the financial market to fully evaluate the Company’s levers for creating value. These include:
- road shows (11 in 2013) in order to meet shareholders and institutional investors in the largest European and North American financial markets;
- sector conferences (eight in 2013), which enable specialist investors in the utilities and infrastructure sector to meet the Company’s top managers;
- one-to-one meetings between management and investors (100 in 2013), in addition to numerous group meetings (30 in 2013);
- conference calls when results are announced (annual, half-yearly and quarterly results), and the presentation of the strategic plan, which is attended by analysts who publish research on the stock.
An Investor Day was also held in 2013, at which the Company presented details of its international strategy to the financial community and also gave a group of investors the chance to visit the infrastructure of Interconnector UK (15.8% owned by Snam) in the south of England.
| Download XLS (31 kB) |
|
Key performance indicators (KPI) GRI - G4: 27 |
|||||||||
|
|
|
|
|
|
|
||||
|
KPI description |
KPI date |
Pre-set target |
Target achieved in 2013 |
Sector |
Status of activity |
||||
|
|||||||||
|
Meetings with socially responsible investors as a % of total meetings |
2010 |
Achieve 33% in 2013 |
40 |
Snam Group |
|
||||
|
Number of meetings with institutional investors |
2010 |
Hold 230 in 2013 |
260 |
Snam Group |
|
||||
|
Number of Investor Days (no) |
2010 |
Hold one during the year |
1 |
Snam Group |
|
||||
During the year there was also a significant amount of communication with Snam’s bond investors and with credit market analysts, through management’s participation in dedicated conferences (three in 2013) and a large number of one-to-one meetings and conference calls.
The Company also continued to communicate with ratings agencies Standard & Poor’s and Moody’s, and maintained an investment-grade credit rating (BBB+ from Standard & Poor’s and Baa1 from Moody’s) that reflects its financial solidity and structure.
Information of interest to shareholders and investors, including quarterly/half-yearly reports, both in Italian and in English, are available in the Investor Relations section on the Company website, www.snam.it.
The same section includes several periodical publications such as the “Financial Markets Review”, which provide a monthly analysis of the financial markets and stock market trends in the utilities sector, Snam’s stock and the shares of its competitors, and “News&Facts”, a quarterly publication aimed specifically at retail investors.
In 2010, the Investor Relations section of the Company website added an interactive version of the “Guide for shareholders”, which is updated semi-annually and provides a summary of useful information for all shareholders to actively follow their investment in Snam.
In 2013, the publication “Sustainability. Creating shared value”, was released. This annual document summarises the sustainability policies that lie behind Snam’s decisions and actions in its relations with stakeholders.
Distribution of added value GRI - G4: EC1
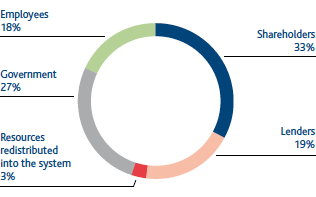
In 2013, Snam distributed to its stakeholders an overall amount of €2,485 million, from added value produced of €2,557 million.
Of this amount, 33% was paid out to shareholders (€845 million), 27% to the government (€690 million), 19% to lenders (€489 million) and 18% to employees (€461 million). The remaining 3% (€72 million) was reinjected into the system.
Net overall added value was distributed among a range of beneficiaries, as follows: (i) employees (direct compensation comprising salaries, wages and post-employment benefits, and indirect compensation consisting of social security expenses, as well as costs for staff services (meal services, travel expense reimbursement, etc.)); (ii) government (income tax); (iii) lenders (interest on loan capital disbursements); and (iv) shareholders (dividends paid out).
DISTRIBUTION OF ADDED VALUE
| Download XLS (23 kB) |
|
Total added value |
|||||
|
|
|
|
|
||
|
|
2011 |
2012 |
2013 |
||
|
|||||
|
Core business revenue |
3,539 |
3,730 |
3,735 |
||
|
Other revenue and income |
66 |
216 |
113 |
||
|
Purchases, services and sundry expenses* |
631 |
760 |
644 |
||
|
Net financial expense |
88 |
431 |
17 |
||
|
Net income from equity investments |
51 |
55 |
45 |
||
|
Increases on internal works – Cost of work and financial expenses |
90 |
91 |
94 |
||
|
Gross total added value |
3,027 |
2,901 |
3,326 |
||
|
less – Amortisation, depreciation and impairment losses |
654 |
706 |
769 |
||
|
Net total added value |
2,373 |
2,195 |
2,557 |
||