Operating review
Gas distribution on the National Transportation Network
Gas volumes are expressed in standard cubic metres (SCM) with a traditional higher heating value (HHV) of 38.1 MJ/SCM (10.572 Kwh/SCM). The basic figure is measured in energy (MJ) and obtained by multiplying the physical cubic metres actually measured by the relative heating value.
| Download XLS (18 kB) |
(billions of m3) |
2014 |
2015 (*) |
2016 |
Change |
% change (**) |
||||||||
|
|||||||||||||
Residential and tertiary |
25.66 |
28.97 |
28.87 |
(0.10) |
(0.4) |
||||||||
Thermoelectric |
17.88 |
20.62 |
23.31 |
2.69 |
13.1 |
||||||||
Industrial (***) |
16.32 |
15.97 |
16.69 |
0.72 |
4.5 |
||||||||
Other (****) |
2.05 |
1.96 |
2.01 |
0.05 |
2.6 |
||||||||
|
61.91 |
67.52 |
70.88 |
3.36 |
5.0 |
||||||||
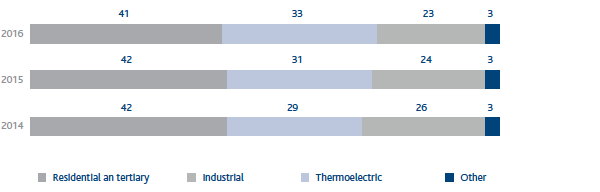
The gas demand in Italy in 2016 was 70.88 billion cubic metres, up 3.36 billion cubic metres (+5.0%) compared with 2015. This increase was related to higher consumption in the thermoelectric sector (+2.69 billion cubic metres; +13.1%), resulting primarily from decreased imports of energy generated by French nuclear plants and the lower supply of hydroelectric energy, as well as higher industrial sector consumption (+0.72 billion cubic metres; +4.5%). These effects were only partly absorbed by the slight reduction in consumption of the residential and tertiary sector (-0.10 billion cubic metres; -0.4%) due essentially to weather trends.
Adjusted for the weather effect, gas demand was estimated at 71.88 billion cubic metres, up by 3.24 billion cubic metres (+4.7%) compared with 2015 (68.64 billion cubic metres).
Gas demand by sector (% of total gas demand)
| Download XLS (18 kB) |
(billions of m3) |
2014 |
2015(*) |
2016 |
Change |
% change |
||||
|
|||||||||
Gas injected into the network by entry point |
55.36 |
60.82 |
65.06 |
4.24 |
7.0 |
||||
Domestic output |
6.89 |
6.43 |
5.57 |
(0.86) |
(13.4) |
||||
Total gas injected into the network |
62.25 |
67.25 |
70.63 |
3.38 |
5.0 |
||||
Net balance of withdrawals from/injections into storage (**) |
(0.86) |
(0.31) |
(0.20) |
0.11 |
(35.5) |
||||
Total availability of natural gas |
61.39 |
66.94 |
70.43 |
3.49 |
5.2 |
||||
The availability of natural gas in Italy (70.43 billion cubic metres) is equal to the sum of gas injected into the National Transportation Network and the net balance of withdrawals from and injections into the storage system, and was up by 3.49 billion cubic metres (+5.2%) compared with 2015. The increase was due to higher volumes of gas injected into the network by entry point (+4.24 billion cubic metres; +7.0%) and higher net withdrawals from the storage system (+0.11 billion cubic metres), the effects of which were partially offset by lower domestic production (-0.86 billion cubic metres; -13.4%).
| Download XLS (18 kB) |
(billions of m3) |
2014 |
2015 (*) |
2016 |
Change |
% change |
||||
|
|||||||||
Domestic output |
6.89 |
6.43 |
5.57 |
(0.86) |
(13.4) |
||||
Entry points (**) |
55.36 |
60.82 |
65.06 |
4.24 |
7.0 |
||||
Tarvisio |
26.16 |
29.92 |
28.26 |
(1.66) |
(5.5) |
||||
Mazara del Vallo |
6.77 |
7.24 |
18.87 |
11.63 |
160.6 |
||||
Gries Pass |
11.43 |
10.63 |
6.70 |
(3.93) |
(37.0) |
||||
Gela |
6.51 |
7.11 |
4.81 |
(2.30) |
(32.3) |
||||
Cavarzere (LNG) |
4.47 |
5.80 |
5.72 |
(0.08) |
(1.4) |
||||
Panigaglia (LNG) |
0.02 |
0.05 |
0.22 |
0.17 |
|
||||
Livorno (LNG) |
|
0.04 |
0.48 |
0.44 |
|
||||
Gorizia |
|
0.03 |
|
(0.03) |
|
||||
|
62.25 |
67.25 |
70.63 |
3.38 |
5.0 |
||||
Injections and withdrawals of gas in the transportation network
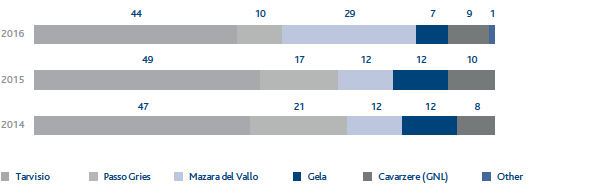
In 2016 a total of 70.63 billion cubic metres of gas was injected into the network, an increase of 3.38 billion cubic metres (+5.0%) compared with 2015.
Injections into the network from domestic production fields or their collection and treatment centres totalled 5.57 billion cubic metres, down by 0.86 billion cubic metres (-13.4%) compared with 2015.
Volumes injected at entry points connected with other countries and with regasification plants, overall equal to 65.06 billion cubic metres, rose by 4.24 billion cubic metres (+7.0%) compared with 2015. This change was due mainly to higher volumes injected at the Mazara del Vallo entry point (+11.63 billion cubic metres) and the LNG regasification plants (+0.53 billion cubic metres; +9%), the effects of which were partly offset by lower volumes injected at the entry points of Gries Pass (-3.93 billion cubic metres; -37%), Gela (-2.30 billion cubic metres; -32.3%), Tarvisio (-1.66 billion cubic metres; -5.5%) and Gorizia (-0.03 billion cubic metres).
Natural gas injected into the network by import point (% of total gas injected)
| Download XLS (18 kB) |
(billions of m3) |
2014 |
2015 |
2016 |
Change |
% change |
||||
|
|||||||||
Redelivery to the domestic market |
60.97 |
66.46 |
69.92 |
3.46 |
5.2 |
||||
Exports and transit (*) |
0.28 |
0.27 |
0.27 |
|
|
||||
Consumption and emissions attributable to Snam Rete Gas |
0.18 |
0.18 |
0.23 |
0.05 |
27.8 |
||||
Gas not accounted for and other changes (**) |
(0.04) |
0.03 |
0.01 |
(0.02) |
(66.7) |
||||
Total withdrawals of natural gas |
61.39 |
66.94 |
70.43 |
3.49 |
5.2 |
||||
The natural gas withdrawn from the National Transportation Network in 2016 (70.43 billion cubic metres) is mainly: (i) redelivery to users at network exit points (69.92 billion cubic metres; -5.2%); (ii) exports and transit (0.27 billion cubic metres); and (iii) consumption by the compression stations and gas emissions from the network and from Snam Rete Gas plants (0.23 billion cubic metres; +27.8%).
| Download XLS (18 kB) |
(billions of m3) |
2014 |
2015 (*) |
2016 |
Change |
% change |
||||||||
|
|||||||||||||
Quantities withdrawn |
61.39 |
66.94 |
70.43 |
3.49 |
5.2 |
||||||||
Exports (-) (***) |
(0.28) |
(0.27) |
(0.27) |
|
|
||||||||
Gas injected into the regional networks of other operators |
0.05 |
0.05 |
0.04 |
(0.01) |
(20.0) |
||||||||
Other consumption (****) |
0.75 |
0.80 |
0.68 |
(0.12) |
(15.0) |
||||||||
Total Italian demand |
61.91 |
67.52 |
70.88 |
3.36 |
5.0 |
||||||||
| Download XLS (19 kB) |
(millions of m3 average/day) |
Calendar year 2014 |
Calendar year 2015 |
Calendar year 2016 |
||||||||
Entry points |
Transportation capacity |
Transferred capacity |
Saturation (%) |
Transportation capacity |
Transferred capacity |
Saturation (%) |
Transportation capacity |
Transferred capacity |
Saturation (%) |
||
|
|||||||||||
Tarvisio |
112.8 |
99.1 |
87.9 |
111.8 |
97.9 |
87.6 |
111.6 |
93.4 |
83.7 |
||
Mazara del Vallo (*) |
102.5 |
86.6 |
84.5 |
101.1 |
85.9 |
85.0 |
91.5 |
84.9 |
92.8 |
||
Gries Pass |
64.4 |
53.7 |
83.4 |
64.4 |
36.6 |
56.8 |
64.4 |
22.1 |
34.3 |
||
Gela (*) |
35.1 |
30.9 |
88.0 |
35.3 |
29.3 |
83.0 |
30.8 |
26.0 |
84.4 |
||
Cavarzere (LNG) |
26.4 |
24.4 |
92.4 |
26.4 |
24.4 |
92.4 |
26.4 |
24.4 |
92.4 |
||
Livorno (LNG) |
15.0 |
15.0 |
100.0 |
15.0 |
15.0 |
100.0 |
15.0 |
15.0 |
100.0 |
||
Panigaglia (LNG) |
13.0 |
7.1 |
54.6 |
13.0 |
4.6 |
35.4 |
13.0 |
0.6 |
4.6 |
||
Gorizia |
4.8 |
0.1 |
2.1 |
4.6 |
0.1 |
2.2 |
4.6 |
|
|
||
Competing capacity (*) |
|
|
|
|
|
|
9.7 |
|
|
||
|
374.0 |
316.9 |
84.7 |
371.6 |
293.8 |
79.1 |
367.0 |
266.4 |
72.6 |
||
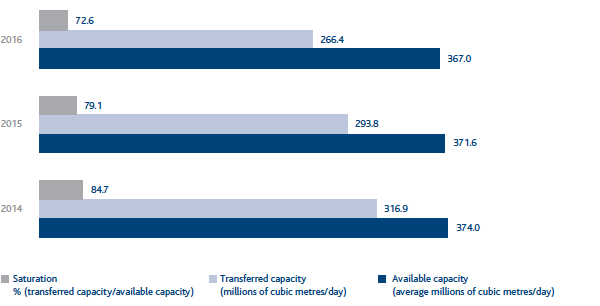
The transportation capacity of the network again covered all user demand in 2016. Average transportation capacity provided in 2016 was 367.0 million cubic metres on average per day, 9.7 of which were offered as competing capacities between the Mazara del Vallo and Gela entry points. In addition to the aforementioned capacities that concern the entry points interconnected with other countries and the LNG terminals, a transportation capacity totalling 27.7 million cubic metres/day is available at the domestic production entry points.
Transportation capacity and saturation
Provision and development of transportation services (GRI: G4-8)
| Download XLS (16 kB) |
|
2014 |
2015 |
2016 |
Active customers (shippers) |
134 |
139 |
136 |
New connection agreements for delivery/redelivery points |
45 |
65 |
45 |
Thanks to the development of services, in the last ten years the Italian gas market has seen a constant increase in transportation operators, from 30 in 2003 to nearly 200 (shippers and traders) today conducting numerous gas exchanges and capacity transactions. In 2016, 45 connection agreements were entered into for the creation of new delivery/redelivery points (of which 2 for injections of biomethane) or to upgrade existing points, and an average of over 370 million cubic metres of transportation capacity was made available daily at network entry points.
Access to the service was provided to all operators which so requested.
In order to manage exchanges among operators and relationships with them, over time Snam has developed IT systems and web portals that now represent a unique feature of the Company that is upgraded regularly.
The development of IT systems and web portals |
||
Systems/Portals |
Role |
Main innovations during the year |
Logistics Gas Application |
Manages the commercial processes of daily scheduling, allocation and provisional and final financial statements. |
|
ServiRe Portal |
Provides users with computerised management of the process of organising the alternative supply service during transportation service interruptions on the SRG gas pipeline network, as well as activities for the disconnection and opening of redelivery points on the transportation network and 24-hour management of the needs of transportation service users, distribution companies and owners of plants connected to the pipeline network. |
|
Myg@sview Portal |
The first version of a veritable dashboard that can be customised by users with a set of available functions has been released into production. This portal is expected to evolve gradually over time. |
|
Commercial area processes were included within the analysis perimeter to obtain the ISO 9001 certification for Snam Rete Gas, which was received in 2016.
Network codes list a number of indicators for monitoring the quality of service offered by the companies. When compared against these indicators, the Snam companies maintained a high level of performance in 2016 as well. One part of these indicators, which refer to specific levels of commercial quality, gives rise to the automatic indemnification of customers in the event of failure to comply with the service quality standard.
| Download XLS (17 kB) |
|
2014 |
2015 |
2016 |
Contracted transportation capacity/Available transportation capacity (foreign entry/interconnection points) (%) |
85 |
86 |
72 |
Compliance with deadlines for issuing connection offers (%) |
100 |
100 |
100 |
Compliance with deadlines for performing services subject to specific commercial quality standards (%) |
100 |
100 |
100 |
Interruptions carried out with sufficient advance notice (%) |
95 |
92 |
98 |
Organisational changes related to operational activities
During the course of 2016, the number of personnel in service fell by a total of 192, from 1,918 at 31 December 2015 to 1,726 at 31 December 2016.
In the first half of 2016, the operating mechanisms necessary for the optimisation of various processes in the area of Operations and Commercial Development were strengthened, particularly with reference to:
- the release of the new IT solution for managing the commercial processes of gas scheduling and balancing, in line with the new requirements imposed by the constant changes in the regulatory and business scenario;
- the continuation of SmartGas project activities.
Following the update of Snam’s organisational structures in force since 1 November 2016, the Snam Rete Gas organisational structure was redefined accordingly, with the attribution of all gas transportation processes and certain staff and operational support services. Please note the following updates:
- transfer to Snam’s new Asset Italia Business Unit of certain staff functions (planning and control, project control, human resources, HSEQ process coordination) and the technical/technological centre, in line with the need to strengthen Snam’s role of guiding and coordinating its operating companies;
- reorganisation/combination of certain pre-existing units dedicated to operating activities (e.g. dispatching, metering, stations), with a view to maximising synergies among the various operating processes;
- transfer of commercial and transportation infrastructure scheduling activities to the new Snam Commercial, Regulation and Development Business Unit, which provides the service to Snam Rete Gas. In any event, Snam Rete Gas still has a unit responsible, in terms of corporate liability, for entering into transportation contracts and developing the Ten-Year Infrastructure Plan.
Accidents (GRI: G4-LA6)
In 2016, the number of accidents dropped significantly for both employees and contract workers.
| Download XLS (16 kB) |
|
2014 |
2015 |
2016 |
Total employee accidents |
7 |
3 |
1 |
Total contract worker accidents |
11 |
7 |
4 |
| Download XLS (17 kB) |
|
2014 |
2015 |
2016 |
||||
|
|||||||
Employees |
|
|
|
||||
Frequency index (*) |
2.23 |
0.97 |
0.32 |
||||
Severity index (**) |
0.17 |
0.05 |
0 |
||||
Contract workers |
|
|
|
||||
Frequency index (*) |
1.84 |
1.13 |
0.65 |
||||
Severity index (**) |
0.08 |
0.05 |
0.05 |
||||
Energy consumption and emission (GRI: G4-EN3, EN15, EN21)
In order to limit natural gas emissions from the transportation network, measures continued to recover gas through on-line recompression interventions and in compression stations (4.5 million cubic metres of natural gas was recovered, equal to 77,780 tonnes of CO2eq, +25% compared with 3.3 million cubic metres in 2015).
In 2016, the installation of the new Poggio Renatico TC4 DLE unit was completed and the Messina TC3 unit was transformed from the traditional type to DLE.
In 2016, nitrous oxide emissions totalled 228 tonnes (+1.3% compared with 2015). The increase was due to the greater use of gas turbines, which entailed a significant increase in the use of fuel gas. The increasingly wide use of DLE turbines, which were employed for 94% of operating time, contributed to significantly limiting the increase in emissions.
| Download XLS (17 kB) |
|
2014 |
2015 |
2016 |
||
|
|||||
Energy consumption (TJ) |
4,153 |
4,278 |
5,824 |
||
CO2eq emissions – Scope 1 (t) (*) |
810,408 |
883,826 |
921,954 |
||
Emissions of natural gas (106 m3) |
37.2 |
37.0 |
34.6 |
||
Natural gas recovered (106 m3) |
3.0 |
3.6 |
4.5 |
||
NOx emissions (t) |
237 |
225 |
228 |
||
| Download XLS (17 kB) |
|
2014 |
2015 |
2016 |
Energy consumption/compressed energy (%) |
0.23 |
0.23 |
0.25 |
CO2 emissions/compressed gas (kg/106m3) |
5,941 |
5,805 |
6,023 |
Natural gas emissions/km of network (m3/km) |
1,151 |
1,138 |
1,066 |
NOx emissions/compressed gas (kg/106m3) |
6.3 |
5.7 |
4.4 |
Regulations concerning the business segment
Relations with the regulatory authority (No.) (GRI: G4-26)
| Download XLS (18 kB) |
|
2014 |
2015 |
2016 |
||||||
|
|||||||||
Responses to reference documents |
5 |
7 |
10 |
||||||
Responses to consultations/observations through associations (*) |
9 |
11 |
14 |
||||||
Tariff proposals |
3 |
3 |
5 |
||||||
Data collections |
100 |
87 |
112 |
||||||
Preliminary investigations (**) |
5 |
3 |
1 |
||||||
Proposal to amend/update contractual documents and codes (***) |
28 |
16 |
12 |
||||||
Proposal to amend/update contractual documents and codes (approved) |
13 |
9 |
12 |
||||||
Tariff regulations for 2016
By means of Resolution 587/2015/R/gas, published on 4 December 2015, the Authority approved the revenue recognised for the transportation, dispatching and metering service for 2016.
Revenue recognised for the natural gas transportation, dispatching and metering service for 2016 amounted to €1,850 million.
The RAB as at 31 December 2014 for transportation, dispatching and metering activities amounted to €15.0 billion.
Tariff regulations for 2017
By means of Resolution 669/2016/R/gas, published on 17 November 2016, the Authority approved the revenue recognised for the natural gas transportation and dispatching service for 2017. Revenue recognised for the natural gas transportation, dispatching and metering service for 2017 amounted to €1,880 million. The RAB as at 31 December 2015 for transportation, dispatching and metering activities amounted to €15 billion. By means of the subsequent Resolution 776/2016/R/gas, published on 28 December 2016, the Authority definitively approved the transportation, dispatching and metering tariffs for 2017, as calculated based on the recognised revenue approved by Resolution 669/2016/R/gas.
Other provisions
“Snam Rete Gas – Regulation criteria for natural gas transportation and dispatching tariffs for the 2014-2017 period”
Under ruling no. 3735/2015 the State Council confirmed the provisions of the Regional Administrative Court of Milan, under ruling 329/2014 regarding the partial annulment of the resolutions of the AEEGSI [Italian Regulatory Authority for Electricity, Gas and Water] no. 514/2013/R/gas, and of the subsequent Resolutions 603/2013/R/gas and 641/2013/R/com, due to the lack of any provision in the relevant rules for a decreasing-scale mechanism for the benefit of end users with high levels of gas consumption.
By means of Resolution 429/2015/R/gas, the Authority launched a procedure, which should have been completed by 31 December 2015, to comply with the aforementioned ruling. This procedure is still pending, and thus the Group is still waiting for the final ruling. In the meantime, the original appellants submitted an application for compliance with the aforementioned ruling before the competent judicial authority. The appeal was discussed on 16 February 2017; therefore, we are currently waiting for the decision of the Milan Regional Administrative Court.
“Snam Rete Gas – Regulation criteria for natural gas transportation and dispatching tariffs for the 2010-2013 period”
By means of Ruling 2888/2015, the CoS rejected the appeal filed by the Authority for review of the judgment of the Regional Administrative Court in Milan No 995/2013, which had annulled the provisions contained in Resolutions ARG/gas/184/09, 192/09, 198/09 and 218/10 regarding natural gas transportation and dispatching tariffs for the 2010-2013 period relating, specifically, to the commodity/capacity distribution, the reform of the entry/exit model and gas intended for consumption by central compressor stations (self-consumption).
By means of Resolution 428/2015/C/gas, the Authority decided to file an appeal for the aforementioned ruling to be overturned on the grounds of factual error. At the same time, the Authority – as a result of the proceedings brought by Resolution 430/2015/R/gas – complied with the aforementioned rulings under Resolution 550/2016/R/gas, with which the Authority, having reformed the discipline of self-consumption, justifiably confirmed the pricing criteria for the rest, partly in light of the consultations carried out.
Given the confirmatory nature of the aforementioned resolution, the original applicant filed an appeal for compliance with the aforementioned rulings and the declaration of nullity of 550/2016/R/gas. By ruling of 1 March 2017, the Regional Administrative Court of Milan partially heard the appeal with specific reference to the issue of the commodity/capacity distribution, believing that with Resolution 550/2016/R/Gas, there has been an inaccurate and partial compliance with ruling 995/2013 and that, therefore, the Authority must carry out an additional assessment as to the effects of the decisions made.