Operating performance
Technical investments
Technical investments for the period totalled €1,199 million (€1,272 million in 2015).
With reference to continuing operations, technical investments for the period totalled €906 million (€879 million in 2015) referred mainly to the natural gas transportation (€776 million) and storage (€117 million) business segments.
Infrastructure development and integration
The main investments for the development of new infrastructure mainly involved work for the reversal of physical transportation flows at interconnection points with northern Europe (€181 million), the upgrade of the transportation network from entry points in southern Italy (€40 million) and the upgrade of the network and connection of new regional and national redelivery points (€119 million). A total of €73 million was invested in 2016 for the development of new storage fields and upgrading capacity.
As a result of the work completed and disposals, the pipeline network in operation remained essentially unchanged in terms of network km (-0.1% compared with 31 December 2015), while installed capacity in compression stations increased by 45.7 MW (+5.2%). Available storage capacity rose by 0.5 billion cubic metres, made available by the new Bordolano deposit, to a level of 12.0 billion cubic metres.
Maintenance of plant security and quality
Investments in projects aimed at maintaining plant security and quality totalled €336 million for transportation and €33 million for storage.
In 2016, pipelines were regularly inspected by foot, vehicle and helicopter to detect hazardous situations that could have had an impact on the integrity of the infrastructure, and an inspection was carried out on the pipeline conditions by inserting smart devices in them to detect any defects.
| Download XLS (17 kB) |
|
2014 |
2015 |
2016 |
Network inspected using smart pigs (km) |
1,950 |
1,315 |
1,660 |
Network inspected by helicopter (km) |
15,700 |
16,330 |
16,218 |
In the area of storage, special attention was paid to the safety of systems and people. In addition to the plant maintenance and improvements, which are constantly being made and are aimed at introducing the best technologies available, specific software has been implemented for the optimum use of deposits and wells, which thanks to the extensive experience and data acquired, enable the system to achieve maximum performance while in compliance with the strict safety rules the company has imposed on itself.
Interconnected transportation-storage capacity and network utilisation
The average transportation capacity provided in 2016 was 367.0 million cubic metres/day on average, which was in line with 2015 (-1.24%), while transferred capacity totalled 266.4 million cubic metres/day on average. Network saturation12 was 72.6%, a decrease compared with 2015 (79.1%).
The number of active transportation users fell from 139 in 2015 to 136 (-2.2%). During the year, 45 connection agreements were entered into for the creation of new delivery/redelivery points.
Overall storage capacity, including strategic storage, was 16.5 billion cubic metres at 31 December 2016, an increase of 0.5 billion cubic metres over 2015, of which 12.0 was available capacity that was fully transferred for the 2016-2017 thermal year, and the remaining 4.5 billion cubic metres was for strategic storage.
There were 91 active storage customers (118 in 2015; -22.9%).
Business volume
The amount of gas introduced into the transportation system stood at 70.63 billion cubic metres, representing an increase of 3.38 billion cubic metres (+5.0%) compared with 2015. The increase is mainly due to the rise in demand for natural gas in Italy (+3.36 billion cubic metres compared with 2015; +5.0%), due essentially to the greater consumption in the thermoelectric sector (+13.1%) partly absorbed by the slight reduction in consumption in the residential and tertiary sector (-0.4%) due essentially to weather conditions.
Volumes of gas moved through the storage system in 2016 amounted to 20.0 billion cubic metres, an increase of 0.42 billion cubic metres, or 2.1%, compared with 2015. The increase was mainly attributable to higher withdrawals from storage (+0.30 billion cubic metres; +3.1%) due to the substantial use of stocks by the operators during the last months of 2016, due mainly to weather conditions and to higher injections to replenish stocks (+0.12 billion cubic metres; +1.2%).
In 2016, 0.21 billion cubic metres of LNG were regasified at the Panigaglia (SP) LNG terminal (0.03 billion cubic metres in 2015 entirely regasified under the scope of the peak shaving service; +0.18 billion cubic metres), of which 0.043 billion cubic metres was under the scope of the natural gas integrated regasification and storage service13.
Key operating figures
In conformity with IFRS 8 “Operating segments”, the operating segments were defined on the basis of the internal reporting used by the Company’s management for allocating resources to the different segments and for analysing the respective performances. With reference to the natural gas distribution segment, on 7 November 2016 the separation of the natural gas distribution activities from Snam took place, which involved the transfer of Snam S.p.A.’s entire equity investment (100%) in Italgas Reti S.p.A. to Italgas S.p.A. (formerly ITG Holding S.p.A.). For the purpose of Snam’s 2016 consolidated financial statements, the distribution segment is no longer represented as an operating segment. Therefore, the operating figures listed below relate to continuing operations (transportation, regasification and storage, as well as data referring to corporate services).
| Download XLS (20 kB) |
|
2014 |
2015 |
2016 |
Change |
% change |
||||||||||
|
|||||||||||||||
Natural gas transportation (a) |
|
|
|
|
|
||||||||||
Natural gas injected into the National Gas Transportation Network (billions of cubic metres) (b) |
62.25 |
67.25 |
70.63 |
3.38 |
5.0 |
||||||||||
Transportation network (kilometres in use) |
32,339 |
32,534 |
32,508 |
(26) |
(0.1) |
||||||||||
Installed power in the compression stations (MW) |
893.9 |
876.5 |
922.2 |
45.7 |
5.2 |
||||||||||
Liquefied natural gas (LNG) regasification (a) |
|
|
|
|
|
||||||||||
LNG regasification (billions of cubic metres) |
0.01 |
0.03 |
0.21 |
0.18 |
|
||||||||||
Natural gas storage (a) |
|
|
|
|
|
||||||||||
Available storage capacity (billions of cubic metres) (c) |
11.4 |
11.5 |
12.0 |
0.5 |
4.3 |
||||||||||
Natural gas moved through the storage system (billions of cubic metres) |
15.70 |
19.58 |
20.00 |
0.42 |
2.1 |
||||||||||
Employees in service at period end (number) (d) (e) |
2,948 |
3,005 |
2,883 |
(122) |
(4.1) |
||||||||||
by business segment: |
|
|
|
|
|
||||||||||
- Transportation |
1,874 |
1,918 |
1,726 |
(192) |
(10.0) |
||||||||||
- Regasification |
77 |
73 |
71 |
(2) |
(2.7) |
||||||||||
- Storage |
291 |
299 |
301 |
2 |
0.7 |
||||||||||
- Corporate and other activities |
706 |
715 |
785 |
70 |
9.8 |
||||||||||
Number of employees
The number of employees in service at 31 December 2016 was 2,883 (3,005 at 31 December 2015), a decrease of 122 (-4.1%) over the previous year. The average number of payroll employees for entities included in the scope of consolidation at 31 December 2016 was 2,804 (2,808 in 2015).
On the one side 2016 featured significant organisational changes also related to the demerger of the distribution business segment and, on the other side, the development of the employment mix, which recorded the following dynamics over the course of the year:
- 177 employees joining, of which 141 were recruited from the market, and 36 others joining, including 32 from non-consolidated companies and 4 returning from leave;
- 299 employees left the company, including 37 as a result of the termination of employment, 16 were terminated unilaterally, 241 transfers to non-consolidated companies and 5 other departures.
With respect to the Group’s national distribution, 2,169 people are employed in the northern regions of Italy, 204 in the central regions and 506 in the south. Furthermore, 4 individuals are permanently employed abroad.
In 2016, note that from the perspective of industrial relations, continued relations with the unions, nationally and locally, included around 105 meetings to analyse the business development projects and share the effects on people resulting for the organisational changes made by the group and examine them in more detail.
- As far as storage is concerned, according to the provisions of the EU Regulation, Resolutions 193/2016/R/gas and 312/2016/R/gas were applied, launching the new balancing regime as a result of which storage companies also had to continuously manage 24-hour renomination cycles. Snam Rete Gas also launched the new balancing scheme as a result of which its commercial dispatching service will operate hourly renomination cycles continuously 24 hours a day known as “Aste Within Day”.
- As far as the transportation business segment is concerned, meetings of the SmartGas project technical committee, made up in equal measure of company and union representatives, continued with the aim of analysing the technical aspects of the project and solving any problems.
- In 2016, GNL and the trade unions, nationally and locally, held various meetings aimed at sharing and comparing subjects intrinsic to the regasification business
In January 2017, the renewal of the National Labour Agreement applied to the group for the three-year period 2016 – 2018, was signed.
Supply chain management (GRI: G4-12)
In 2016, through the new organisational model, the supply chain function came under the Chief Corporate Services Officer, who has the task of applying strategic sourcing methods, achieving savings targets in line with business activities and maintaining an adequate group of suppliers.
Strategic sourcing plays a key role in identifying future purchasing policies and has a direct impact on cutting costs. Starting with the gathering of procurement requirements over a five-year period, anticipated spending is analysed and qualified in order to guide the purchase process and identify the categories of “strategic” goods on which to focus attention.
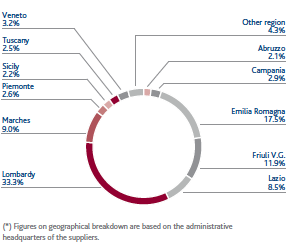
In 2016 Snam directly provided work for around 660 companies, 388 of which belong to the small-medium business sector (SME), concluding over 1,000 procurement contracts (in line with 2015), worth a total of approximately €1.36 billion (+7.1% compared with 2015). Among the goods purchased the most important material is steel (piping, connectors, etc.) which, in 2016, amounted to a supply of approximately 15,200 tonnes.
95.6% of the procured concerns national businesses, and was distributed throughout the Italian regions in line with the Company’s roots in the country.
At 31 December, the vendor list included 2,245 qualified suppliers, and around 400 suppliers were in the process of being renewed or obtaining new qualifications. The supply chain was checked and monitored with 15 audits during the qualification phase of critical suppliers, and 634 feedback reports collected on services rendered by 185 suppliers. Additionally, 1,502 suppliers and sub-contractors were checked with regard to the regularity of contributions, through 3,089 inspections which led to 87 irregularities intercepted (2.8%). There were 40 provisions issued for non-compliance, including warnings, suspensions and withdrawal of qualification.
In the procurement of work, which is the most important category because it is related to core activities, the suppliers considered critical (critical levels A and B) were all in possession of quality and environment management systems certified with ISO 9001 and ISO 14001 standards. In 2016, the target of having all (100%) of these suppliers in possession of OHSAS 18001 certification (occupational health and safety) improved compared with 2015 when the figure already stood at 90%.
Procurement by region and merchandise category
GEOGRAPHICAL BREAKDOWN PROCUREMENT IN ITALY (*)
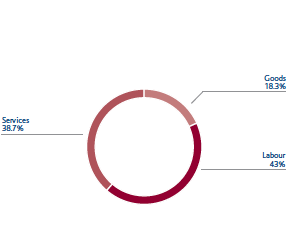
PROCUREMENT BY PRODUCT CATEGORY
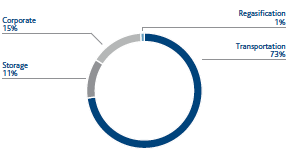
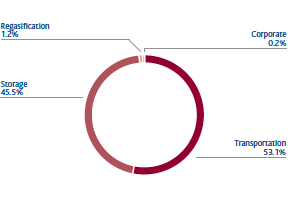
PROCUREMENT BY BUSINESS SEGMENT
Accidents (GRI: G4-LA6)
Snam has managed, over time, to reduce accidents, both as far as employees are concerned and contractor’s personnel, as evidenced by the accident frequency and severity index. The entire company, starting from the top, is focused on workplace safety, to the point of it being a corporate objective for executives and managers, on which part of the variable remuneration is based. There were 9 accidents in 2016, none of them fatal.
| Download XLS (16 kB) |
|
2014 |
2015 |
2016 |
||||||
|
|||||||||
Total employee accidents (*) |
9 |
3 |
4 |
||||||
Total contract worker accidents |
15 |
8 |
5 |
||||||
| Download XLS (18 kB) |
|
2014 |
2015 |
2016 |
||||||
|
|||||||||
Employees and contract workers |
|
|
|
||||||
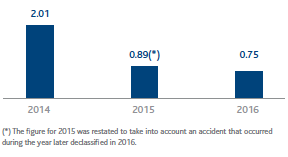
Frequency index (*) |
2.01 |
0.89 |
0.75 |
||||||
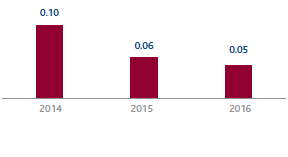
Severity index |
0.1 |
0.06 |
0.05 |
||||||
Employees |
|
|
|
||||||
Frequency index (*) |
1.84 |
0.62 |
0.81 |
||||||
Severity index |
0.11 |
0.03 |
0.04 |
||||||
Contract workers |
|
|
|
||||||
Frequency index |
2.13 |
1.07 |
0.71 |
||||||
Severity index |
0.1 |
0.07 |
0.05 |
||||||
Employee and contract worker accident graphs
EMPLOYEE AND CONTRACTOR ACCIDENTS AT WORK -
FREQUENCY INDEX
EMPLOYEE AND CONTRACTOR ACCIDENTS AT WORK -
SEVERITY INDEX
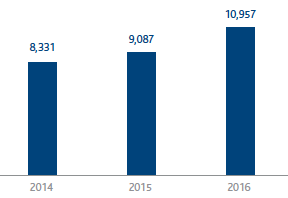
Energy consumption
In 2016, Snam energy consumption totalled around 10,957 Tera joules (TJ), an increase of +20.6% over 2015.
The increase is partly attributable to the greater quantity of gas transported (+5% compared with 2015), but above all to the different transportation conditions that have seen an increase in quantities of gas from North Africa (+65% compared with 2015) and a simultaneous reduction in quantities from Northern Europe (-37%) and Russia (-5.6%).
The most heavily used energy source was natural gas, which covered 96.2% of total energy needs. Other sources used are electricity (2.9%) and other fuels (diesel fuel, gasoline, LPG and heat), which together are equivalent to 0.9%.
Energy consumption data (GRI: G4-EN3)
ENERGY CONSUMPTION (TJ)
ENERGY CONSUMPTION BY ACTIVITY
Greenhouse gas emissions (GRI: G4-EN15)
Direct emissions of CO2eq – Scope 1 (103 t) (*)
TOTAL DIRECT GHG EMISSIONS - SCOPE 1 (KT CO2EQ)
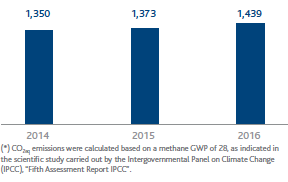
In 2016 direct CO2eq emissions were equal to approximately 1.44 million tonnes. Direct CO2 emissions from combustion were equal to approximately 0.6 million tonnes, while CO2eq emissions from methane stood at approximately 0.84 million tonnes. In 2016 natural gas emissions fell by -3% compared with 2015, going from 49.7 Mm3 to 48.2 Mm3. This decrease is partly due to the lower emissions recorded in 2016 and partly to the emission reduction initiatives conducted under gas transportation activities, in which measures that involve the recovery of gas through recompression on line and in compression stations were implemented (4.5 million cubic metres of natural gas recovered, equal to 77,780 tonnes of CO2eq, +25% compared with the figure of 3.3 million cubic metres in 2015).
At the start of the third regulatory period (2013-2020), the greenhouse gas emission authorisation system, previously governed by Legislative Decree 216/2006, was updated and modified by Legislative Decree 30 of 13 March 2013, effective from 5 April 2013. According to the new provisions, the main aim of the decree was to update laws on greenhouse gas emission authorisations and to continually reduce free emission allowances. The allowances will be assigned to each plant on a gradually decreasing basis, and will no longer be constant (as in the second regulatory period), and will also depend on the actual functionality of the plants.
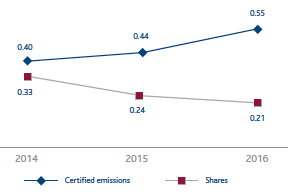
In 2016, the Snam Group’s total CO2 emissions, certified by an accredited body according to the provisions of the competent national authority, amounted to approximately 0.550 million tonnes, out of total annual allowances of approximately 0.207 million issued by the Ministry for the Environment, Land and Sea (negative balance of 0.343 million allowances). This deficit is offset by the allowances already present in the registers for Snam Group plants, accumulated thanks to the surplus from previous years.
Activities |
Number of plants |
Name of plants |
Transportation |
11 |
Gas compression stations in Enna, Gallese, Istrana, Malborghetto, Masera, Melizzano, Messina, Montesano, Poggio Renatico, Tarsia, Terranuova Bracciolini |
Storage |
8 |
Storage gas compression stations in Cortemaggiore, Fiume Treste, Minerbio, Ripalta, Sabbioncello, Sergnano, Settala and Bordolano |
Regasification |
1 |
Liquefied natural gas plant in Panigaglia |
CO2 emissions from ETS plants (GRI: G4-EC2)
CO2 emissions ETS plants (106 t)
12 Ratio of capacity transferred to available capacity
13 The integrated storage and regasification service, introduced by Article 14, paragraph 1 of Decree-Law 1 of 24 January 2012 and later governed by the Ministerial Decree of 25 February 2016, makes provision that the leading storage company makes delivered quantities of gas equivalent to LNG available to the user for the uniform storage service, minus consumption and leaks, by the end of the month after unloading. The physical management of gas flows for redelivery of gas in storage takes place by coordinating the regasification and storage companies involved. For more information about this service, please refer to the section “Operating performance by business segment – Regasification of Liquefied Natural Gas (LNG)” of this Report.