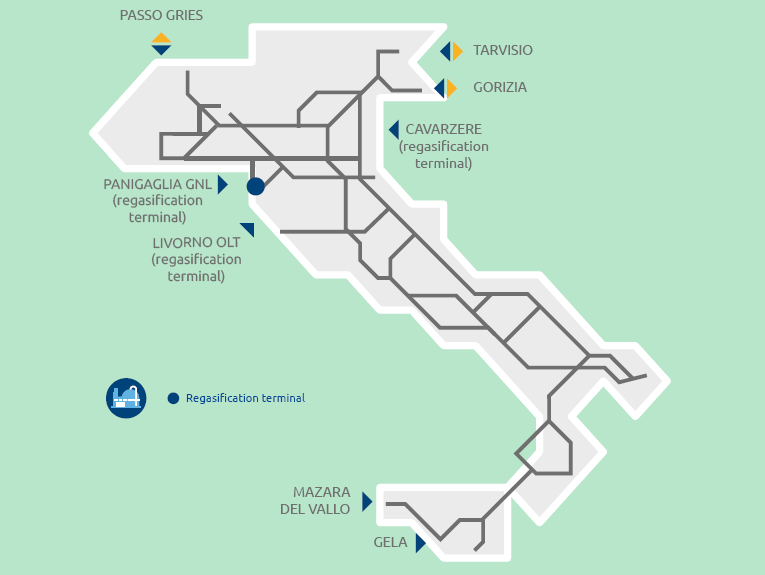
Snam presence in regasification in Italy
GNL Italia plays a key role in ensuring adequate diversification and flexibility of supplies to the gas system

Maximum daily regasification capacity of the Panigaglia terminal
17,500
cubic metres
Maximum annual quantity of natural gas injectable into the transport network
3.5
bcm
LNG quantity regasified in 2017 at Panigaglia
0.63
bcm
The Panigaglia plant, built in 1971 and owned by GNL Italia, is able to regasify 17,500 cubic metres of LNG every day; under conditions of maximum efficiency, it can supply more than 3.5 billion cubic metres of natural gas into the transport network every year. In 2017, the total gas regasified at the Panigaglia plant amounted to 0.63 billion cubic metres (0.21 billion cubic metres in 2016), of which 0.084 billion cubic metres were regasified in the context of integrated regasification service and storage. In 2017, 15 landfills from methane tankers were performed (5 landfills in 2016), of which 2 were landfills in the context of the integrated service.
Throughout 2017, GNL Italia had 4 active customers, (the same as in 2016).
The Decree from the Ministry for Economic Development on 25 February 2016 determined that a storage capacity of 1 billion m3 should be reserved for the integrated storage and re-gasification service, and that the regasification companies and the main storage companies should collaborate to enable the redelivery of regasified LNG to the users directly for storage, by the end of the month following its unloading from methane tankers. With regard to the contractual period from 1 April 2017 – 31 March 2018, the Ministerial Decree of 7 December 2016, subsequently integrated into Ministerial Decree of 13 February 2017, established that a storage space equal to 1.5 billion metres 3should be set aside for an integrated regasification and storage service, in order to allow industrial companies to purchase LNG directly from other countries. The service involves the injection of amounts of regasified gas into storage, minus consumption and losses, by the end of the month after the same amount of LNG has been unloaded.
| Download XLS (18 kB) |
(€ million) |
2015 |
2016 |
2017 |
Change |
Change % |
||||||||
|
|||||||||||||
Total revenue (a) |
25 |
19 |
22 |
3 |
15.8 |
||||||||
Regulated revenue (a) |
19 |
18 |
21 |
3 |
16.7 |
||||||||
- revenue items offset in costs |
1 |
|
3 |
3 |
|
||||||||
Operating costs (a) |
19 |
12 |
15 |
3 |
25.0 |
||||||||
EBIT |
1 |
(5) |
2 |
7 |
|
||||||||
Net invested capital at 31 December |
89 |
93 |
89 |
(4) |
(4.3) |
||||||||
Technical investments (b) |
7 |
7 |
5 |
(2) |
(28.6) |
||||||||
Volumes of regasified LNG (billions of cubic metres) (c) (d) |
0.03 |
0.21 |
0.63 |
0.42 |
|
||||||||
Tanker loads (number) |
1 |
5 |
15 |
10 |
|
||||||||
Employees in service at 31 December (number) |
73 |
71 |
63 |
(8) |
(11.3) |
||||||||