Injections into and withdrawals from the transportation network
In 2017, a total of 74.59 billion cubic metres of gas was injected into the network, an increase of 3.95 billion cubic metres (+ 5.6%) compared with 2016.
Injections into the network from domestic production fields or collection and treatment centres totalled 5.24 billion cubic metres, down by 0.33 billion cubic metres (-5.9%) compared to 2016.
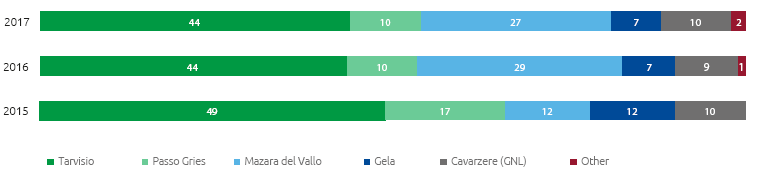
The volumes injected at entry points connected with other countries and with regasification plants, equalled 69.35 billion cubic metres overall, a rise of 4.28 billion cubic metres (+ 6.6%) compared to 2016.This change is attributable to the higher volumes introduced by LNG regasification plants (+1.96 billion cubic metres, + 30.5%) and the Tarvisio entry point (+1.91 billion cubic metres; + 6.8%) and Passo Gries (+0.55 billion cubic metres, + 8.2%), the effects of which were partly offset by lower volumes introduced via the Gela entry points (-0.17 billion cubic metres; -3.5%)
Natural gas injected into the network per importation point (% of total gas injected into the network)
| Download XLS (17 kB) |
(billions of m3) |
2015 |
2016 |
2017 |
Change |
Change % |
||||
|
|||||||||
Redelivery to the domestic market |
66.46 |
69.91 |
73.98 |
4.07 |
5.8 |
||||
Exports and transits (*) |
0.27 |
0.27 |
0.33 |
0.06 |
22.2 |
||||
Consumption and emissions attributable to Snam Rete Gas |
0.18 |
0.23 |
0.27 |
0.04 |
17.4 |
||||
Unaccounted-for gas (UFG) and other changes (**) |
0.03 |
0.03 |
0.23 |
0.20 |
|
||||
Total withdrawals of natural gas |
66.94 |
70.44 |
74.81 |
4.37 |
6.2 |
||||
The natural gas withdrawn from the National Transportation Network in 2017 (74.81 billion cubic metres) was mainly:(i) for re-supply to users at network exit points (73.98 billion cubic metres; + 5.8%); (ii) exports and transit (0.33 billion cubic metres, +22.2%); and (iii) for consumption by compression stations and gas emissions from the network and Snam Rete Gas plants (0.27 billion cubic metres; + 17.4%).
| Download XLS (17 kB) |
(billions of m3) |
2015 |
2016 (*) |
2017 |
Change |
Change % (**) |
||||||||
|
|||||||||||||
Quantities withdrawn |
66.94 |
70.44 |
74.81 |
4.37 |
6.2 |
||||||||
Exports (-) (***) |
(0.27) |
(0.27) |
(0.33) |
(0.06) |
22.2 |
||||||||
Gas injected into the regional networks of other operators |
0.05 |
0.04 |
0.03 |
(0.01) |
(25.0) |
||||||||
Other consumption (****) |
0.80 |
0.70 |
0.63 |
(0.07) |
(10.0) |
||||||||
Total Italian demand |
67.52 |
70.91 |
75.14 |
4.23 |
6.0 |
||||||||
| Download XLS (18 kB) |
(millions of m3 average/day) |
Calendar year 2015 |
Calendar year 2016 |
Calendar year 2017 |
||||||||
|
|||||||||||
Entry points |
Transport capacity |
Transferred capacity |
Saturation (%) |
Transport capacity |
Transferred capacity |
Saturation (%) |
Transport capacity |
Transferred capacity |
Saturation (%) |
||
Tarvisio |
111.8 |
97.9 |
87.6 |
111.6 |
93.4 |
83.7 |
111.4 |
94.6 |
84.9 |
||
Mazara del Vallo (*) |
101.1 |
85.9 |
85.0 |
91.5 |
84.9 |
92.8 |
84.4 |
78.3 |
92.8 |
||
Gries Pass |
64.4 |
36.6 |
56.8 |
64.4 |
22.1 |
34.3 |
64.4 |
22.4 |
34.7 |
||
Gela (*) |
35.3 |
29.3 |
83.0 |
30.8 |
26.0 |
84.4 |
23.8 |
22.0 |
92.4 |
||
Cavarzere (LNG) |
26.4 |
24.4 |
92.4 |
26.4 |
24.4 |
92.4 |
26.4 |
24.4 |
92.5 |
||
Livorno (LNG) |
15.0 |
15.0 |
100.0 |
15.0 |
15.0 |
100.0 |
15.0 |
15.0 |
100.0 |
||
Panigaglia (LNG) |
13.0 |
4.6 |
35.4 |
13.0 |
0.6 |
4.6 |
13.0 |
2.0 |
15.5 |
||
Gorizia |
4.6 |
0.1 |
2.2 |
4.6 |
|
|
4.6 |
0.1 |
|
||
Competing capacity (*) |
|
|
|
9.7 |
|
|
21.2 |
|
|
||
|
371.6 |
293.8 |
79.1 |
367.0 |
266.4 |
72.6 |
364.2 |
258.8 |
71.0 |
||
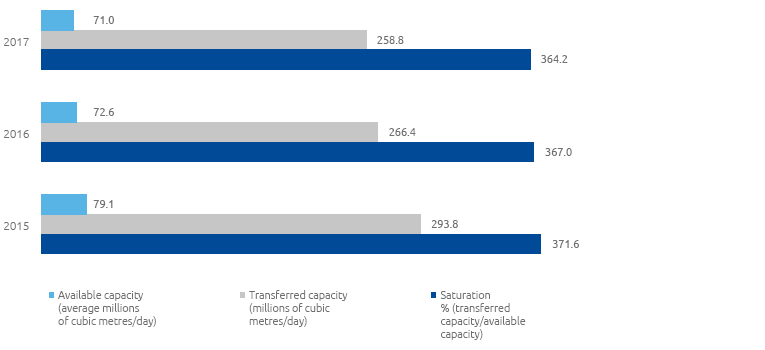
The transportation capacity of the network again covered all user demand in 2017.Average transportation capacity provided in 2017 was 364.2 million cubic metres on average per day, 21.2 million cubic metres of which were offered as competing capacities between the Mazara del Vallo and Gela entry points. In addition to the aforementioned capacities which concern the entry points interconnected with foreign countries and the LNG terminals, a transportation capacity is available at the domestic production entry points:
- national production at a total of 25.2 million cubic metres/day;
- the production of biomethane at a total of 0.1 million cubic metres/day.
Snam Rete Gas has prepared a long-term plan for available transportation capacity, which was sent to the Ministry of Economic Development on 30 June 2017 and published on the Business & Services section www.snam.it.
The document shows data about capacity at all entry points interconnected with foreign countries and with LNG terminals for the thermal year 2017-2018 and subsequent years up to 30 September 2032.
Also shown for the thermal year 2017-2018 are the transport capacities of the interconnected exit points with the foreign countries of Passo Gries, Gorizia, Bizzarone and San Marino at a total of 11.0 million cubic metres/day. On the Tarvisio exit point, 18 million cubic metres/day of interruptible transport capacity is available, subject to the presence of an incoming physical flow or a null physical flow at the Passo Gries entry point. For the exit point from Passo Gries, there is currently a transport capacity equal, physically, to 5 million cubic metres/day, and projects are underway to build a physical transport capacity of up to 40 million cubic metres/day by the end of 2018.
Transport capacity and saturation
| Download XLS (16 kB) |
|
2015 |
2016 |
2017 |
Active customers (shippers) |
139 |
136 |
128 |
New connection agreements for delivery/redelivery points |
65 |
45 |
78 |
Since the start of July 2017, commercial management of the 3 businesses concerned with transport, storage and regasification, respectively headed by Snam Rete Gas, Stogit and GNL Italia, have been merged into Snam within a single organisation.
In 2017, 78 connection contracts were signed for the construction of new delivery/redelivery points (of which 13 were for biomethane injection) or the upgrading of existing points. Via the PRISMA platform, with the new balancing regime that’s been in operation since October 2016, operators can respectively operate gas exchanges and carry out transport capacity transactions on an infra-daily, daily, monthly, quarterly or annual basis, for up to a maximum of 15 years. To promote even greater flexibility of the system, in compliance with the Authority’s Resolutions no. 336/2016/R/gas and 512/2017/R/gas, the Italian gas system has the possibility of booking monthly and daily transport capacity at the redelivery points, and related withdrawal areas that feed electricity generation plants.
This new mode of access to the gas transport system is combined with the needs of the electricity system to have more flexible assignment methods, so it can respond in a timely and efficient way to changes in the operating conditions of the electricity system.
To manage customer relations, Snam currently uses numerous software applications and web portals that have been developed over time, represent a distinguishing capital for the company and are continuously updated. In particular, Snam provides the Myg@sview Portal, a tool aimed at supporting timely and flexible communications, that allows a set of"smart" data to be personalised according to individual needs, as well as direct communications with them, and inform them via SRG ("chat" mode).This tool has been improved and expanded over time by incorporating suggestions from operators, particularly in reference to needs related to the new balancing regime. In 2017, this tool was integrated further by increasing its usability, through the in production release of a new version of the extended Help-online section, with simple training “tablets” that provide immediate, intuitive support to users about using the myg@sview portal and individual Widgets, a quick guide for printing, and a video about the creation and development of the myg@sview portal.
In addition, the project to revise the information content in the “Business & Services” area of the Snam Rete Gas website was started and has been completed following the launch of the new balancing model. The objective was to improve the usability of information for customers, and introduce the use of graphic forms of representation.
Within the network codes are lists of a series of indicators for monitoring the quality of services offered by the companies. When compared against these indicators, the Snam companies maintained a high level of performance, even in 2016.One part of these indicators, which refers to specific levels of business quality, gives rise to automatic indemnification of customers in the event of a failure to comply with service quality standards.
| Download XLS (16 kB) |
|
2015 |
2016 |
2017 |
Contracted transport capacity/Available transport capacity (foreign entry/interconnection points) (%) |
86 |
72 |
71 |
Compliance with deadlines for issuing offers for connection (%) |
100 |
100 |
100 |
Compliance with deadlines for performing services subject to specific business quality standards (%) |
100 |
100 |
100 |
Interruptions carried out with adequate advance notice (%) |
92 |
98 |
98 |
Organisational changes related to operational activities
During the course of 2017, the recorded number of personnel in service fell by a total of 220, from 1,726 on 31 December 2016 to 1,946 at 31 December 2017.The increase was due to implementation of the Integra Project and, in particular, to the transfer of the “Plants and technical services” business unit from Stogit to Snam Rete Gas, which entailed transferring 221 staff members to the Snam Rete Gas company.
During 2017, the operational mechanisms needed to optimise the diverse processes in the Operations area were strengthened, particularly with regard to continuation of SmartGas project activities, which were aimed at revising the regulations and maintenance standards for gas pipelines and power plants, activating new professional roles operating in the territory, developing and implementing more advanced digital and IT solutions for managing operational processes and consolidating and developing procurement activities, particularly by creating a dedicated unit for procuring goods, works and services specifically for the compressed natural gas business, for activities upstream of the storage business as well as for international activities and strengthening the centralised coordinating role of materials management activity.
In addition, with a view to enhancing and organisation of the synergic integration of Italian assets and, after the transfer process starting from 1 July 2017, of the Stogit business units “Plants and Technical Services”, the skilled roles of Snam Rete Gas in the context of Plant Management, Dispatching & Measurements, Engineering and Construction and Supply Chain have taken direct control of the operations, maintenance and control activities for storage facilities, storage dispatching operations and engineering activities, and implementation of investment projects related to surface facilities, improvements to plant engineering and the procurement of goods, works and services related to the business of storage.
On 1 October, the assets of the facility forming the subject of integration were optimised with a view to maximising synergies between the various operating processes and promoting total integration, which will have to be finalised during 2018 with specific projects of a design nature.
In the second half of the year, the project to streamline and simplify the current regulatory framework for Snam Rete Gas was launched, and the implementation phase for this will be developed in 2018.
Accidents
During the course of 2017, the number of accidents, involving both employees and contractors, remained in line with the previous year. It should be noted that as regards contractors, one fatal accident occurred.
| Download XLS (16 kB) |
|
2015 |
2016 |
2017 |
Total employee accidents |
3 |
1 |
2 |
Total contract worker accidents |
7 |
4 |
4 |
| Download XLS (17 kB) |
|
2015 |
2016 |
2017 |
||||
|
|||||||
Employees |
|
|
|
||||
Frequency index (*) |
0.97 |
0.32 |
0.66 |
||||
Severity index (**) |
2.48 |
0.004 |
0.03 |
||||
Contract workers |
|
|
|
||||
Frequency index (*) |
1.13 |
0.65 |
0.47 |
||||
Severity index (**) |
0.05 |
0.05 |
0.9 |
||||
Energy consumption and emissions
In order to limit natural gas emissions from the transport network, measures were taken to recover gas through online re-compression interventions and at compression stations (4.1 million cubic metres of natural gas was recovered, equal to 71,500 tonnes of CO2 eq).
In 2017, nitrous oxide emissions totalled 341.9 tonnes (+ 49.9% compared to 2016).The increase was mainly attributable to the higher volumes of gas transported. To reduce emissions, a program has been underway for several years to modify some of the existing turbines and to install new units with low-emission combustion systems (DLE).
| Download XLS (17 kB) |
|
2015 |
2016 |
2017 |
||
|
|||||
Energy consumption (TJ) |
4,278 |
5,824 |
7,459 |
||
Emissions of CO2eq – scope1 (ton) (*) |
883,826 |
921,954 |
1,008,051 |
||
Emissions of natural gas (106 m3) |
37.0 |
34.6 |
34.4 |
||
Natural gas recovered (106 m3) |
3.6 |
4.5 |
4.1 |
||
NO x emissions (tonnes) |
225 |
228 |
342 |
||